All posts

Follow Us

LinkedInInstagramX
Quarterly ResultsArchiveLast updated 19 November 20263 min read

Vraj Iron & Steel (VRAJ) Q2 FY27 Profit Rises 35% as Capex Costs Bite

Vraj Iron & Steel posted a 40.7% jump in Q2 FY27 revenue, but higher finance and depreciation costs from expansion plans squeezed net margins lower.

By Abhinav Swaroop, CFA, Chief Business Officer: Hexawealth · Created 19 November 2026

Vraj Iron & Steel reported strong revenue growth of 40.7% YoY in Q2 FY27, with profit up 35.5%. However, net profit margins contracted due to a sharp rise in finance costs and depreciation from debt-funded capital expenditure.

For a steelmaker like Vraj Iron & Steel, growth often comes with a heavy price tag. The company's September quarter delivered a 40.7% surge in revenue, but the profit that reached shareholders was held back by the costs of funding its own expansion.

The numbers show a business scaling up while its margins thin out. Revenue for Q2 FY27 stood at ₹187.11 crore, with net profit at ₹10.50 crore. While profit grew 35.5% year-on-year, it fell 8.8% from the previous quarter.

Revenue & profit

Revenue (₹ Cr)

Net Profit (₹ Cr)

Revenue & profitSep 2025 (Q2 FY26) 132.98, Dec 2025 (Q3 FY26) 146.43, Mar 2026 (Q4 FY26) 170.21, Jun 2026 (Q1 FY27) 193.83, Sep 2026 (Q2 FY27) 187.11. Sep 2025 (Q2 FY26) 7.75, Dec 2025 (Q3 FY26) 1.10, Mar 2026 (Q4 FY26) 15.57, Jun 2026 (Q1 FY27) 11.51, Sep 2026 (Q2 FY27) 10.500100200300400Sep 2025Dec 2025Mar 2026Jun 2026Sep 2026
  • Revenue (₹ Cr), Sep 2025 (Q2 FY26): 132.98
  • Revenue (₹ Cr), Dec 2025 (Q3 FY26): 146.43
  • Revenue (₹ Cr), Mar 2026 (Q4 FY26): 170.21
  • Revenue (₹ Cr), Jun 2026 (Q1 FY27): 193.83
  • Revenue (₹ Cr), Sep 2026 (Q2 FY27): 187.11
  • Net Profit (₹ Cr), Sep 2025 (Q2 FY26): 7.75
  • Net Profit (₹ Cr), Dec 2025 (Q3 FY26): 1.10
  • Net Profit (₹ Cr), Mar 2026 (Q4 FY26): 15.57
  • Net Profit (₹ Cr), Jun 2026 (Q1 FY27): 11.51
  • Net Profit (₹ Cr), Sep 2026 (Q2 FY27): 10.50

Revenue (₹ Cr)

Revenue (₹ Cr)Sep 2025 (Q2 FY26) 132.98, Dec 2025 (Q3 FY26) 146.43, Mar 2026 (Q4 FY26) 170.21, Jun 2026 (Q1 FY27) 193.83, Sep 2026 (Q2 FY27) 187.110100200300400Sep 2025Dec 2025Mar 2026Jun 2026Sep 2026
  • Revenue (₹ Cr), Sep 2025 (Q2 FY26): 132.98
  • Revenue (₹ Cr), Dec 2025 (Q3 FY26): 146.43
  • Revenue (₹ Cr), Mar 2026 (Q4 FY26): 170.21
  • Revenue (₹ Cr), Jun 2026 (Q1 FY27): 193.83
  • Revenue (₹ Cr), Sep 2026 (Q2 FY27): 187.11

Net Profit (₹ Cr)

Net Profit (₹ Cr)Sep 2025 (Q2 FY26) 7.75, Dec 2025 (Q3 FY26) 1.10, Mar 2026 (Q4 FY26) 15.57, Jun 2026 (Q1 FY27) 11.51, Sep 2026 (Q2 FY27) 10.5005101520Sep 2025Dec 2025Mar 2026Jun 2026Sep 2026
  • Net Profit (₹ Cr), Sep 2025 (Q2 FY26): 7.75
  • Net Profit (₹ Cr), Dec 2025 (Q3 FY26): 1.10
  • Net Profit (₹ Cr), Mar 2026 (Q4 FY26): 15.57
  • Net Profit (₹ Cr), Jun 2026 (Q1 FY27): 11.51
  • Net Profit (₹ Cr), Sep 2026 (Q2 FY27): 10.50

Net Profit Margin (%)

Net Profit Margin (%)Sep 2025 (Q2 FY26) 5.8, Dec 2025 (Q3 FY26) 0.7, Mar 2026 (Q4 FY26) 9.1, Jun 2026 (Q1 FY27) 5.9, Sep 2026 (Q2 FY27) 5.60%5%10%15%20%Sep 2025Dec 2025Mar 2026Jun 2026Sep 2026
  • Net Profit Margin (%), Sep 2025 (Q2 FY26): 5.8
  • Net Profit Margin (%), Dec 2025 (Q3 FY26): 0.7
  • Net Profit Margin (%), Mar 2026 (Q4 FY26): 9.1
  • Net Profit Margin (%), Jun 2026 (Q1 FY27): 5.9
  • Net Profit Margin (%), Sep 2026 (Q2 FY27): 5.6
MetricCurrentSep 2026 (Q2 FY27)PreviousJun 2026 (Q1 FY27)
Revenue (₹ Cr)
187.11
193.83
Net Profit (₹ Cr)
10.50
11.51
Net Profit Margin (%)
5.6
5.9

Why the bottom line didn't keep up

The core operations actually became more efficient. According to Stockwatch, the operating margin expanded to 10.59% from 10.09% a year ago. This was supported by a strong pricing environment, with government data showing TMT bar prices rising 21% year-on-year in September.

Yet, the net profit margin fell. It compressed to 5.56%, down 20 basis points year-on-year and 30 points sequentially. The culprit was a 216% surge in finance costs to ₹1.20 crore and a 44.6% jump in depreciation to ₹7.58 crore.

These costs are directly tied to funding new capacity. Non-current borrowings rose to ₹47.99 crore from ₹33.99 crore at FY26-end, Stockwatch reported. Capital work-in-progress nearly tripled, signaling active investment.

Live Chart

· VRAJ

(BSE)

ISIN: INE0S2V01010

The expansion engine and its fuel

The company is in the midst of a multi-phase expansion. It received fresh Terms of Reference for a greenfield steel plant in October, as noted by MCapital. This follows the recent commissioning of a new billet plant and a captive solar power unit.

This growth is funded by debt, which explains the soaring interest expense. While the balance sheet remains conservative with a low debt-to-equity ratio, the immediate income statement is bearing the cost of future capacity.

A cautious market reaction

Investors focused on the margin pressure. According to MarketPing, the stock fell 6.0% on the results day, underperforming the ferrous metals sector median. MarketsMojo noted the stock has underperformed its sector by over 24 percentage points in the past year.

The market's skepticism is understandable. With no analyst coverage or formal management guidance, as per Stockwatch, the story is purely in the reported numbers: strong top-line momentum being offset by the financial weight of expansion.

Key Points

  • Revenue grew 40.7% year-on-year to ₹187.11 crore, though it dipped 3.5% from the record high of the previous quarter.
  • Net profit increased 35.5% year-on-year but declined 8.8% quarter-on-quarter as net margins contracted.
  • The margin squeeze was driven by finance costs that more than tripled and a 44.6% rise in depreciation, linked to debt-funded capital expenditure.
  • The stock fell sharply on the results day, reflecting investor concern over profitability despite robust revenue growth.

Hexa Perspective

Vraj Iron & Steel is caught in a classic growth trap. The business is successfully riding a wave of strong steel demand and pricing, as evidenced by the operating margin improvement. However, every rupee of profit is being contested by the rising costs of the capital needed to build its future.

The next few quarters will test whether this is a temporary phase or a structural shift. The key is whether volume growth and operating leverage from new capacities can outpace the rising finance and depreciation charges. Until that crossover is visible, the stock may continue to discount the strong headline growth.

Share or follow HexaWealth

Also read

Want this applied to your portfolio?

Talk to a HexaWealth advisor, or sync your mutual fund data for insights tailored to your holdings.
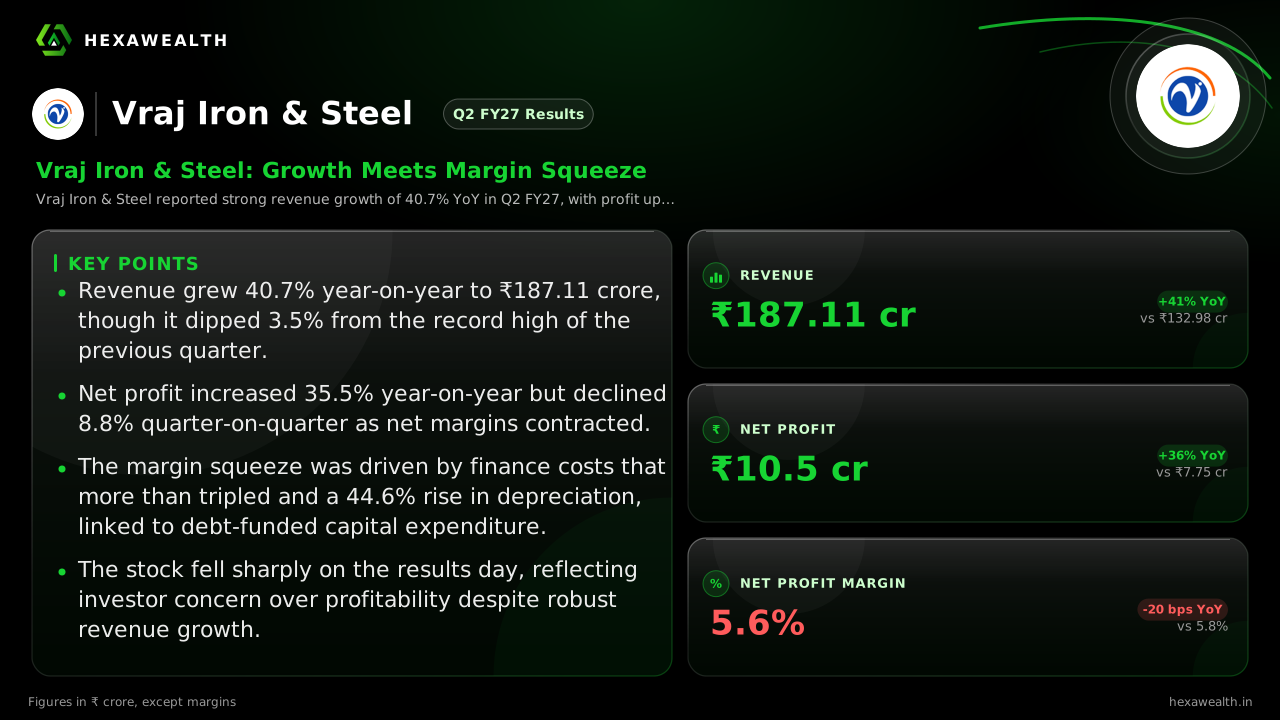
Vraj Iron & Steel (VRAJ) Q2 FY27 results, revenue and profits.

Frequently asked questions

What were Vraj Iron & Steel's Q2 FY27 results?
Vraj Iron & Steel reported consolidated revenue of ₹187.11 crore for Q2 FY27 (July-September 2026), a 40.7% increase year-on-year. Net profit was ₹10.50 crore, up 35.5% from the same quarter last year. However, profit declined 8.8% compared to the previous quarter (Q1 FY27).
Why did Vraj Iron & Steel's net profit margin decline in Q2 FY27?
Vraj Iron & Steel's net profit margin fell to 5.6% in Q2 FY27 from 5.8% a year ago due to sharply higher finance and depreciation costs. According to Stockwatch, finance costs surged 216% year-on-year to ₹1.20 crore, and depreciation rose 44.6% to ₹7.58 crore, driven by debt-funded capital expenditure for expansion projects.
What drove the 40.7% revenue growth for Vraj Iron & Steel in Q2 FY27?
Vraj Iron & Steel's 40.7% year-on-year revenue growth in Q2 FY27 was driven by strong demand and better realizations. Government data cited in reports shows TMT bar prices were up 21% year-on-year in September 2026. The company also benefited from higher volumes as it ramped up newly commissioned capacity.
Why did Vraj Iron & Steel's profit before tax decline 6.3% QoQ in Q2 FY27?
Vraj Iron & Steel's profit before tax declined 6.3% quarter-on-quarter in Q2 FY27 primarily due to rising costs. While revenue dipped slightly, expenses like finance costs rose 20.5% and other expenses increased significantly, compressing profitability from the previous quarter's level.
What caused the 216% year-on-year surge in interest expense for Vraj Iron & Steel?
Vraj Iron & Steel's interest expense surged 216% year-on-year in Q2 FY27 due to higher borrowings taken to fund capital expenditure. Stockwatch reported non-current borrowings rose to ₹47.99 crore from ₹33.99 crore at the end of FY26, directly linking the cost increase to funding for expansion projects like the new greenfield plant.
What are Vraj Iron & Steel's ongoing capacity expansion plans?
Vraj Iron & Steel is actively expanding, with plans including a new greenfield integrated steel plant for which it received fresh environmental Terms of Reference in October 2026. The company recently commissioned a new billet plant and a captive solar power unit, with further investments in a rolling mill and solar expansion underway, largely funded by debt.
What was the pricing environment for TMT bars in the September 2026 quarter?
The pricing environment for TMT bars was strong in the September 2026 quarter. According to government data from PIB, the average price for TMT bars (10 mm) in September 2026 was ₹65,298 per tonne, marking a 21% increase year-on-year and a 12.6% rise from the previous month, supporting Vraj Iron & Steel's revenue growth.
What is the status of Vraj Iron & Steel's working capital and cash flow?
Vraj Iron & Steel's working capital improved in Q2 FY27, with inventories and trade receivables declining from March 2026 levels. For the first half of FY27, the company generated ₹13.04 crore in cash from operations, a significant improvement from ₹0.35 crore in H1 FY26, as reported by MarketPing.
Did Vraj Iron & Steel's Q2 FY27 results beat analyst estimates?
There were no formal analyst estimates to beat or miss. According to Stockwatch, aggregator data shows zero analysts currently cover the stock, and there was no prior management guidance on record, making a comparison to street estimates impossible for Vraj Iron & Steel's Q2 FY27 results.
How did Vraj Iron & Steel's stock price react to the Q2 FY27 results?
Vraj Iron & Steel's stock price reacted negatively to the Q2 FY27 results. MarketPing reported the stock fell 6.0% on the reaction day (November 14, 2026), significantly underperforming the median move for the ferrous metals industry, which was down 1.8%, as investors focused on the sequential profit decline and margin pressure.
Vraj Iron & Steel Q2 FY27 results order book
The available research snippets for Vraj Iron & Steel's Q2 FY27 results do not provide specific information on the company's order book or backlog position for TMT bars and billets as of September 2026. The filings and reports analyzed focus on financial performance rather than forward-looking order intake.
Vraj Iron & Steel Q2 net profit
Vraj Iron & Steel's consolidated net profit for Q2 FY27 (quarter ended September 2026) was ₹10.50 crore. This represents a 35.5% increase from the ₹7.75 crore net profit reported in Q2 FY26, but an 8.8% decrease from the ₹11.51 crore profit in the previous quarter (Q1 FY27).