Seemax Resources (SEEMAX) Q2 FY27 Posts Wider Loss as IPO-Funded Costs Hit
The material handling equipment firm's first half-year loss widened to ₹1.61 crore as employee and other expenses surged post its July IPO.
Seemax Resources reported a ₹1.61 crore loss for H1 FY27, a sharp reversal from the prior quarter's profit. Revenue was flat year-on-year, but costs surged as the company deployed IPO funds into its fleet and operations.
For a company that just raised fresh capital to grow, Seemax Resources' September quarter shows the cost of that ambition arriving before the reward. The material handling equipment renter swung to a deeper loss as it spent IPO money on its fleet and people, while core revenue remained stagnant.
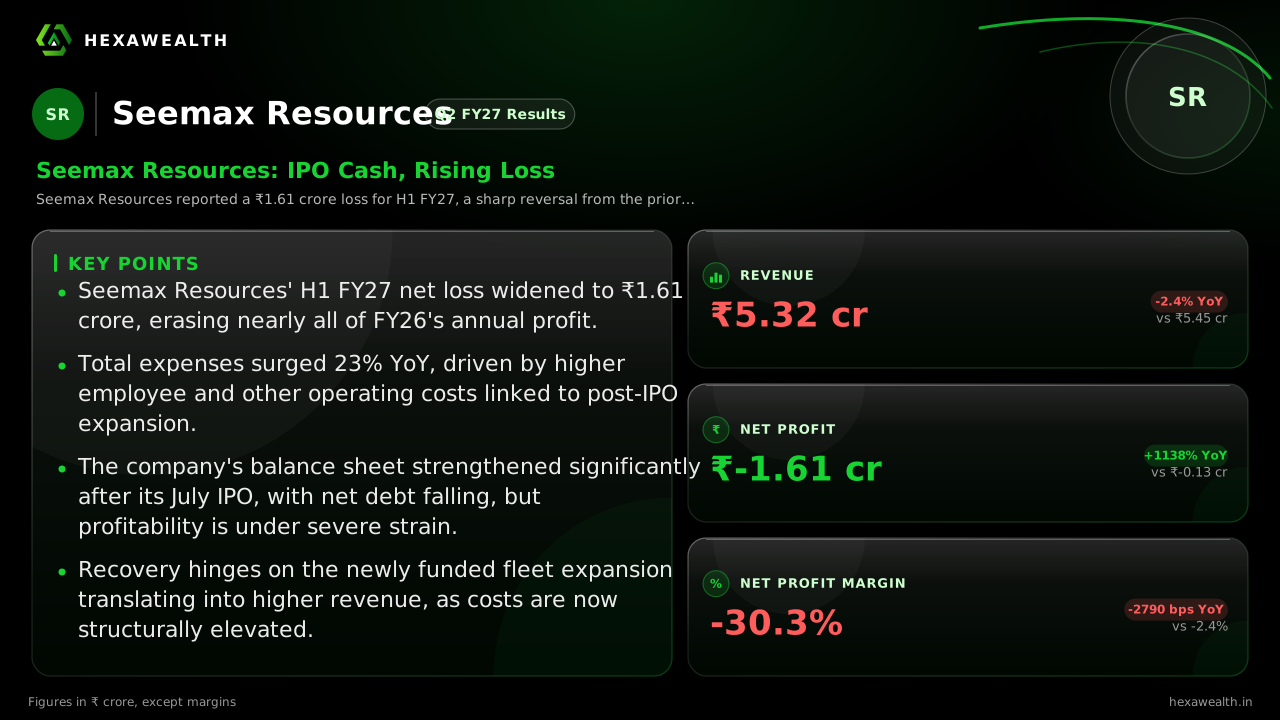
The numbers tell a story of a business under pressure. Revenue of ₹5.32 crore was nearly flat year-on-year but fell 36% from the strong March quarter. The net loss widened to ₹1.61 crore from a small ₹0.13 crore loss a year ago, and collapsed from a ₹1.88 crore profit last quarter.
Revenue & profit
Revenue (₹ Cr)
Profit (₹ Cr)
- Revenue (₹ Cr), Q4 FY25 (Mar 2025): 9.57
- Revenue (₹ Cr), Q2 FY26 (Sep 2025): 5.45
- Revenue (₹ Cr), Q4 FY26 (Mar 2026): 8.29
- Revenue (₹ Cr), Q2 FY27 (Sep 2026): 5.32
- Profit (₹ Cr), Q4 FY25 (Mar 2025): 2.13
- Profit (₹ Cr), Q2 FY26 (Sep 2025): -0.13
- Profit (₹ Cr), Q4 FY26 (Mar 2026): 1.88
- Profit (₹ Cr), Q2 FY27 (Sep 2026): -1.61
Revenue (₹ Cr)
- Revenue (₹ Cr), Q4 FY25 (Mar 2025): 9.57
- Revenue (₹ Cr), Q2 FY26 (Sep 2025): 5.45
- Revenue (₹ Cr), Q4 FY26 (Mar 2026): 8.29
- Revenue (₹ Cr), Q2 FY27 (Sep 2026): 5.32
Profit (₹ Cr)
- Profit (₹ Cr), Q4 FY25 (Mar 2025): 2.13
- Profit (₹ Cr), Q2 FY26 (Sep 2025): -0.13
- Profit (₹ Cr), Q4 FY26 (Mar 2026): 1.88
- Profit (₹ Cr), Q2 FY27 (Sep 2026): -1.61
Net Profit Margin
- Net Profit Margin, Q4 FY25 (Mar 2025): 22.3%
- Net Profit Margin, Q2 FY26 (Sep 2025): -2.4%
- Net Profit Margin, Q4 FY26 (Mar 2026): 22.7%
- Net Profit Margin, Q2 FY27 (Sep 2026): -30.3%
| Metric | CurrentQ2 FY27 (Sep 2026) | PreviousQ4 FY26 (Mar 2026) |
|---|---|---|
| Revenue (₹ Cr) | 5.32 | 8.29 |
| Profit (₹ Cr) | -1.61 | 1.88 |
| Net Profit Margin | -30.3% | 22.7% |
The Cost of Building the Fleet
The primary driver of the loss was a sharp rise in operating expenses, which jumped 23% year-on-year. According to a report by Multibagg.ai, employee benefits expense rose to ₹3.70 crore and other expenses more than doubled to ₹1.51 crore. This surge is linked to the company's post-IPO expansion, as it hired more people and incurred costs to integrate new equipment.
At the same time, a crucial income stream dried up. Other income, which was ₹0.62 crore in the March quarter, collapsed to just ₹0.08 crore. This removed a cushion that had previously supported profitability.
A Stronger Balance Sheet, For Now
The quarter's paradox is a rapidly strengthening balance sheet alongside a deteriorating profit statement. Seemax listed on the BSE SME platform in July after raising ₹19.74 crore. MCapital notes ₹10 crore of this was earmarked for capital expenditure, with ₹5.47 crore already spent by September, boosting fixed assets.
Live Chart
· SEEMAX
(BSE)
ISIN: INE1EVO01017
This spending has slashed net debt, but it also increases depreciation and interest costs before new equipment generates rental income. The path to recovery now depends entirely on whether this fresh capacity can be deployed to win new contracts and boost revenue meaningfully in the coming quarters.
Key Points
- Seemax Resources' H1 FY27 net loss widened to ₹1.61 crore, erasing nearly all of FY26's annual profit.
- Total expenses surged 23% YoY, driven by higher employee and other operating costs linked to post-IPO expansion.
- The company's balance sheet strengthened significantly after its July IPO, with net debt falling, but profitability is under severe strain.
- Recovery hinges on the newly funded fleet expansion translating into higher revenue, as costs are now structurally elevated.
Hexa Perspective
This quarter lays bare the classic growth-investment squeeze. Seemax is spending its IPO cash to build capacity, but those costs—higher payroll, depreciation, and interest—are hitting the P&L immediately. Revenue, constrained by customer concentration and a regional focus, has yet to respond.
The investment case now turns on a simple equation: can the company secure enough new rental contracts to fill its expanded fleet? Until that happens, the losses incurred this quarter are likely to persist. Investors are left weighing a repaired balance sheet against vanishing near-term earnings.
Also read
Want this applied to your portfolio?
Talk to a HexaWealth advisor, or sync your mutual fund data for insights tailored to your holdings.