NSB BPO (NSBBPO) Profit Stalls as Margins Shrink in Q2 FY27
NSB BPO Solutions reported flat year-on-year profit despite a small revenue gain, as operating costs and a sequential decline weighed on performance.
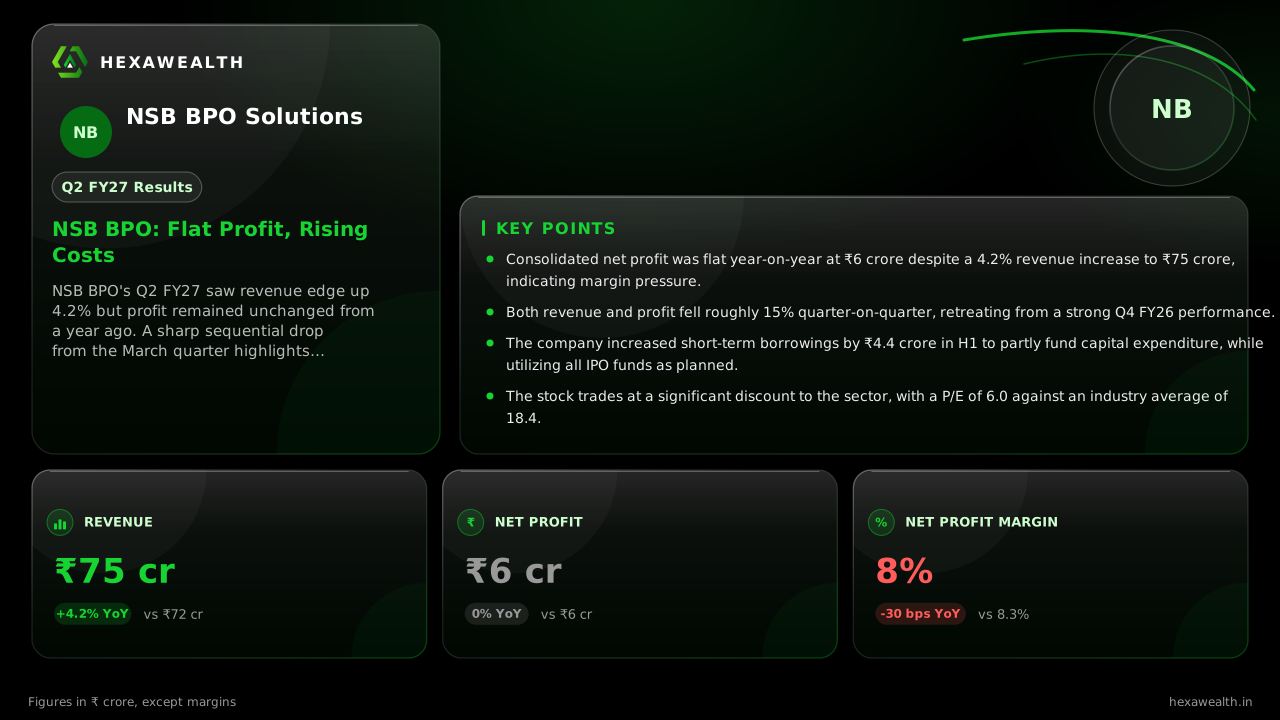
NSB BPO's Q2 FY27 saw revenue edge up 4.2% but profit remained unchanged from a year ago. A sharp sequential drop from the March quarter highlights margin pressure and a challenging growth environment.
For a business process outsourcer, growth hinges on adding clients and managing the cost of delivering their services. NSB BPO Solutions' September quarter shows the tension between those two forces, with revenue inching forward but profitability taking a step back.
The company posted a consolidated net profit of ₹6 crore for Q2 FY27, identical to the year-ago quarter. Revenue grew 4.2% year-on-year to ₹75 crore. The flat bottom line masks a more telling sequential trend, with both revenue and profit down about 15% from the strong ₹88 crore sales quarter in March 2026.
Revenue & profit
Revenue (₹ Cr.)
Profit (₹ Cr.)
- Revenue (₹ Cr.), Sep 2024 (Q2 FY25): 70.0
- Revenue (₹ Cr.), Mar 2025 (Q4 FY25): 68.0
- Revenue (₹ Cr.), Sep 2025 (Q2 FY26): 72.0
- Revenue (₹ Cr.), Mar 2026 (Q4 FY26): 88.0
- Revenue (₹ Cr.), Sep 2026 (Q2 FY27): 75.0
- Profit (₹ Cr.), Sep 2024 (Q2 FY25): 5.0
- Profit (₹ Cr.), Mar 2025 (Q4 FY25): 6.0
- Profit (₹ Cr.), Sep 2025 (Q2 FY26): 6.0
- Profit (₹ Cr.), Mar 2026 (Q4 FY26): 7.0
- Profit (₹ Cr.), Sep 2026 (Q2 FY27): 6.0
Revenue (₹ Cr.)
- Revenue (₹ Cr.), Sep 2024 (Q2 FY25): 70.0
- Revenue (₹ Cr.), Mar 2025 (Q4 FY25): 68.0
- Revenue (₹ Cr.), Sep 2025 (Q2 FY26): 72.0
- Revenue (₹ Cr.), Mar 2026 (Q4 FY26): 88.0
- Revenue (₹ Cr.), Sep 2026 (Q2 FY27): 75.0
Profit (₹ Cr.)
- Profit (₹ Cr.), Sep 2024 (Q2 FY25): 5.0
- Profit (₹ Cr.), Mar 2025 (Q4 FY25): 6.0
- Profit (₹ Cr.), Sep 2025 (Q2 FY26): 6.0
- Profit (₹ Cr.), Mar 2026 (Q4 FY26): 7.0
- Profit (₹ Cr.), Sep 2026 (Q2 FY27): 6.0
Net Profit Margin
- Net Profit Margin, Sep 2024 (Q2 FY25): 7.1%
- Net Profit Margin, Mar 2025 (Q4 FY25): 8.8%
- Net Profit Margin, Sep 2025 (Q2 FY26): 8.3%
- Net Profit Margin, Mar 2026 (Q4 FY26): 8.0%
- Net Profit Margin, Sep 2026 (Q2 FY27): 8.0%
| Metric | CurrentSep 2026 (Q2 FY27) | PreviousMar 2026 (Q4 FY26) |
|---|---|---|
| Revenue (₹ Cr.) | 75.0 | 88.0 |
| Profit (₹ Cr.) | 6.0 | 7.0 |
| Net Profit Margin | 8.0% | 8.0% |
Why the top line didn't reach the bottom
A 30-basis-point year-on-year contraction in net profit margin explains why a ₹3 crore revenue increase yielded no extra profit. Analysis by mcapital.in suggests the company's operating margin fell 60-70 basis points in the first half of FY27. This points to rising employee and other operating costs that consumed the modest revenue gain.
A 50% reduction in interest expense provided some relief, but it wasn't enough to offset the operating squeeze. The flat profit outcome suggests the core business of processing and support services is facing cost pressures that are outpacing pricing power in the current environment.
The balance sheet tells a parallel story
While the income statement showed strain, the company's cash flow and investment activity were more active. A report from multibagg.ai notes NSB BPO generated ₹9.58 crore in operating cash flow for the half-year but invested ₹11.82 crore in fixed assets.
Live Chart
· NSBBPO
(BSE)
ISIN: INE0SLP01017
This capex was funded partly by a ₹4.42 crore increase in short-term borrowings. The company confirmed its IPO proceeds of ₹64.13 crore are fully utilized as planned, with ₹13 crore earmarked for new project capital expenditure, according to a filing cited by alphatribe.in.
A market priced for caution
The stock rose over 10% on the results day, but the valuation context is stark. At a trailing P/E of 6.0, NSB BPO trades at a 68% discount to the IT services industry average of 18.4. This deep discount reflects the market's view of its modest growth trajectory and margin challenges ahead.
Key Points
- Consolidated net profit was flat year-on-year at ₹6 crore despite a 4.2% revenue increase to ₹75 crore, indicating margin pressure.
- Both revenue and profit fell roughly 15% quarter-on-quarter, retreating from a strong Q4 FY26 performance.
- The company increased short-term borrowings by ₹4.4 crore in H1 to partly fund capital expenditure, while utilizing all IPO funds as planned.
- The stock trades at a significant discount to the sector, with a P/E of 6.0 against an industry average of 18.4.
Hexa Perspective
This quarter underscores a transition from the post-IPO growth spurt to a more measured phase. The margin contraction, even on slightly higher sales, suggests the company is absorbing cost inflation or competitive pricing to maintain its client base.
The path forward depends on whether the recent capital expenditure translates into higher-margin service offerings or simply maintains existing capacity. With the services sector outlook moderating, as noted in an RBI survey, NSB BPO's ability to improve profitability will be the key metric to watch, more than top-line growth alone.
Also read
Want this applied to your portfolio?
Talk to a HexaWealth advisor, or sync your mutual fund data for insights tailored to your holdings.