Mid East Portfolio (MIDEASTP) Q2 FY27's Revenue Jumps 3,719% as Trading Business Kicks In
The financial services firm saw a massive revenue surge driven by stock-in-trade purchases, but profitability was severely squeezed by soaring expenses.
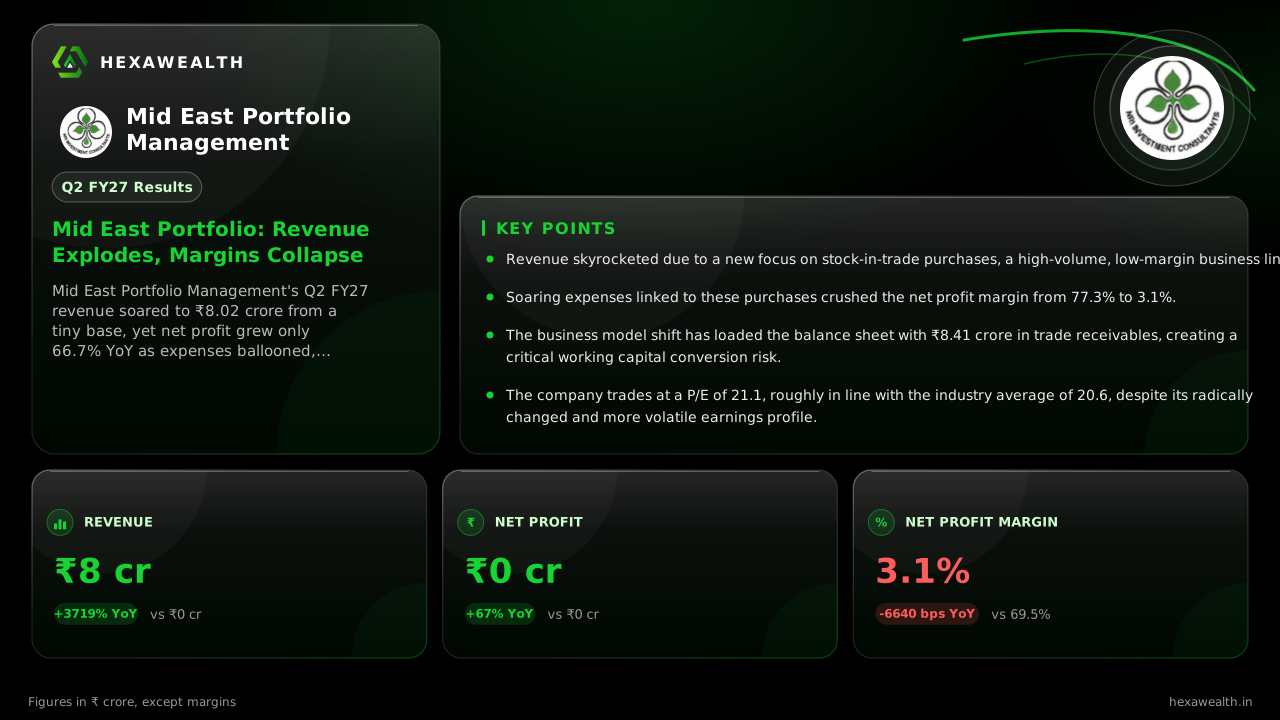
Mid East Portfolio Management's Q2 FY27 revenue soared to ₹8.02 crore from a tiny base, yet net profit grew only 66.7% YoY as expenses ballooned, collapsing the net profit margin to 3.1%.
For a company that has historically reported minimal revenue, Mid East Portfolio Management's September quarter marks a dramatic shift into a high-volume, low-margin trading business. Revenue exploded to ₹8.02 crore, but the bottom line tells a story of profitability sacrificed for scale.
The numbers show a business transformed. Revenue surged 3,719% year-on-year and 2,573% from the prior quarter. Net profit rose a more modest 66.7% YoY to ₹0.25 crore. The real story is in the margins, which collapsed from 77.3% last quarter to just 3.1%.
Revenue & profit
Revenue (₹ Cr)
Profit (₹ Cr)
- Revenue (₹ Cr), Q2 FY26: 0.21
- Revenue (₹ Cr), Q3 FY26: 0.04
- Revenue (₹ Cr), Q4 FY26: 0.05
- Revenue (₹ Cr), Q1 FY27: 0.30
- Revenue (₹ Cr), Q2 FY27: 8.02
- Profit (₹ Cr), Q2 FY26: 0.15
- Profit (₹ Cr), Q3 FY26: -0.01
- Profit (₹ Cr), Q4 FY26: -0.50
- Profit (₹ Cr), Q1 FY27: 0.23
- Profit (₹ Cr), Q2 FY27: 0.25
Revenue (₹ Cr)
- Revenue (₹ Cr), Q2 FY26: 0.21
- Revenue (₹ Cr), Q3 FY26: 0.04
- Revenue (₹ Cr), Q4 FY26: 0.05
- Revenue (₹ Cr), Q1 FY27: 0.30
- Revenue (₹ Cr), Q2 FY27: 8.02
Profit (₹ Cr)
- Profit (₹ Cr), Q2 FY26: 0.15
- Profit (₹ Cr), Q3 FY26: -0.01
- Profit (₹ Cr), Q4 FY26: -0.50
- Profit (₹ Cr), Q1 FY27: 0.23
- Profit (₹ Cr), Q2 FY27: 0.25
Net Profit Margin (%)
- Net Profit Margin (%), Q2 FY26: 69.5
- Net Profit Margin (%), Q3 FY26: -23.7
- Net Profit Margin (%), Q4 FY26: —
- Net Profit Margin (%), Q1 FY27: 77.3
- Net Profit Margin (%), Q2 FY27: 3.1
| Metric | CurrentQ2 FY27 | PreviousQ1 FY27 | Same quarter LYQ2 FY26 |
|---|---|---|---|
| Revenue (₹ Cr) | 8.02YoY +3719% | 0.30 | 0.21 |
| Profit (₹ Cr) | 0.25YoY +67% | 0.23 | 0.15 |
| Net Profit Margin (%) | 3.1YoY -96% | 77.3 | 69.5 |
The trading engine that drove the surge
According to Flash Finance, the revenue jump was driven by stock-in-trade purchases of ₹7.72 crore. This single activity, which essentially represents trading securities, accounted for over 96% of the quarter's total revenue. It marks a sharp pivot from the company's traditional, low-revenue portfolio management services.
This new activity came with immense costs. Total expenses ballooned to ₹7.77 crore from just ₹0.07 crore in Q1, a jump of over 11,000% quarter-on-quarter. Flash Finance notes these expenses were directly linked to the purchase of stock-in-trade. The result is a wafer-thin profit margin that leaves little room for error.
A balance sheet now full of promises
This trading spree has fundamentally altered the company's working capital. Flash Finance reports trade receivables surged to ₹8.41 crore as of September 30, 2026, from zero at the end of March. Trade payables also rose to ₹7.91 crore. The company must now successfully collect these receivables to convert its top-line growth into cash.
Live Chart
· MIDEASTP
(BSE)
ISIN: INE033E01015
Management has not provided explicit guidance on sustaining this revenue run-rate. StockFin.ai notes the company is in a phase of operational uncertainty, pursuing exploratory initiatives like a non-binding MOU with Cher Lifestyle for potential funding.
Key Points
- Revenue skyrocketed due to a new focus on stock-in-trade purchases, a high-volume, low-margin business line.
- Soaring expenses linked to these purchases crushed the net profit margin from 77.3% to 3.1%.
- The business model shift has loaded the balance sheet with ₹8.41 crore in trade receivables, creating a critical working capital conversion risk.
- The company trades at a P/E of 21.1, roughly in line with the industry average of 20.6, despite its radically changed and more volatile earnings profile.
Hexa Perspective
The quarter reveals a company chasing growth but finding it in a low-quality form. The astronomical revenue growth is structurally different from earning fees on assets under management, which is the core of the high-margin PMS industry.
The sustainability of this model hinges entirely on the company's ability to collect its receivables and manage inventory without losses. With a negative ROE and volatile earnings history, the margin of safety is thin. Investors are effectively betting on Mid East's successful transition from a dormant financial services entity to an active trading house.
Also read
Want this applied to your portfolio?
Talk to a HexaWealth advisor, or sync your mutual fund data for insights tailored to your holdings.