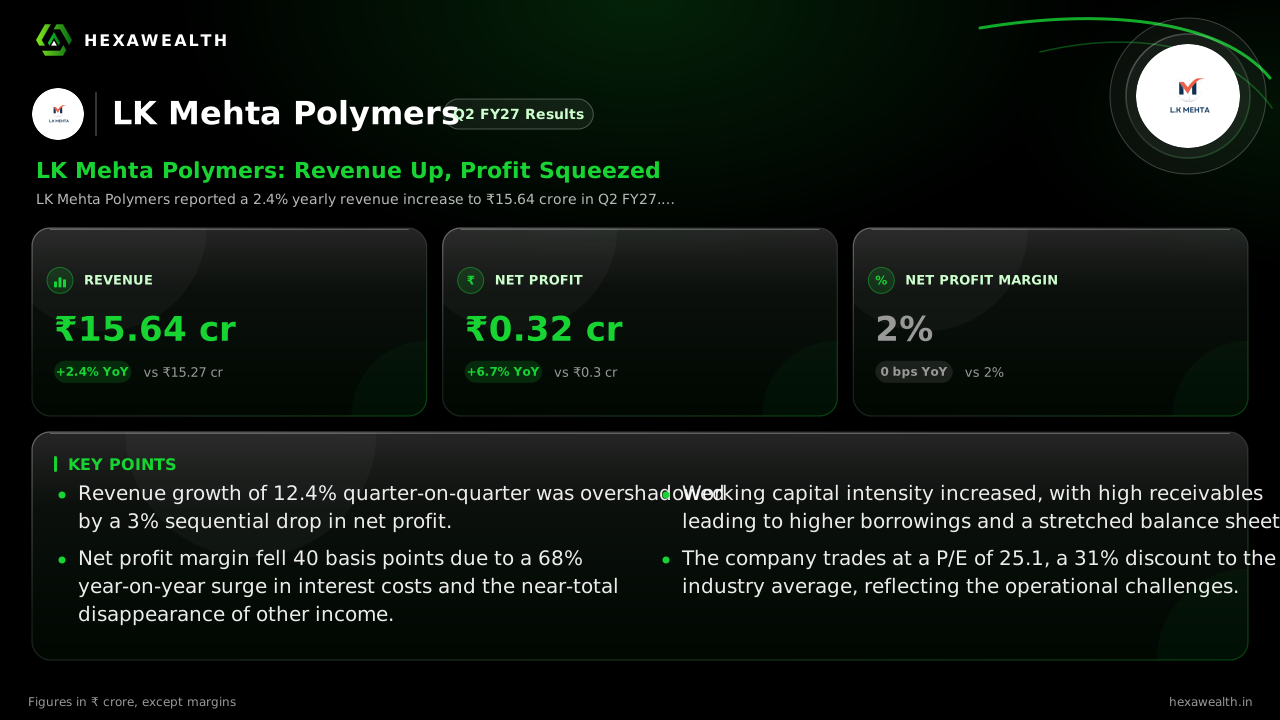
LK Mehta Polymers reported a 2.4% yearly revenue increase to ₹15.64 crore in Q2 FY27. However, net profit margin fell 40 basis points sequentially as interest costs surged 68% year-on-year, pressuring the bottom line.
For a small manufacturer of plastic ropes and granules, the challenge is turning sales into profit before working capital costs swallow the gains. LK Mehta Polymers' September quarter did just that, delivering higher sales but a weaker bottom line as costs rose faster.
The company's revenue reached ₹15.64 crore, up 12.4% from the previous quarter and 2.4% from a year ago. Yet net profit slipped 3% sequentially to ₹0.32 crore. The net profit margin compressed to 2.0%, down 40 basis points from the March quarter.
Revenue & profit
Revenue (₹ Cr)
Net Profit (₹ Cr)
Revenue (₹ Cr), Q3 FY25 (Dec 2024): 4.75
Revenue (₹ Cr), Q4 FY25 (Mar 2025): 11.86
Revenue (₹ Cr), Q2 FY26 (Sep 2025): 15.27
Revenue (₹ Cr), Q4 FY26 (Mar 2026): 13.92
Revenue (₹ Cr), Q2 FY27 (Sep 2026): 15.64
Net Profit (₹ Cr), Q3 FY25 (Dec 2024): 0.16
Net Profit (₹ Cr), Q4 FY25 (Mar 2025): 0.35
Net Profit (₹ Cr), Q2 FY26 (Sep 2025): 0.30
Net Profit (₹ Cr), Q4 FY26 (Mar 2026): 0.33
Net Profit (₹ Cr), Q2 FY27 (Sep 2026): 0.32
Revenue (₹ Cr)
Revenue (₹ Cr), Q3 FY25 (Dec 2024): 4.75
Revenue (₹ Cr), Q4 FY25 (Mar 2025): 11.86
Revenue (₹ Cr), Q2 FY26 (Sep 2025): 15.27
Revenue (₹ Cr), Q4 FY26 (Mar 2026): 13.92
Revenue (₹ Cr), Q2 FY27 (Sep 2026): 15.64
Net Profit (₹ Cr)
Net Profit (₹ Cr), Q3 FY25 (Dec 2024): 0.16
Net Profit (₹ Cr), Q4 FY25 (Mar 2025): 0.35
Net Profit (₹ Cr), Q2 FY26 (Sep 2025): 0.30
Net Profit (₹ Cr), Q4 FY26 (Mar 2026): 0.33
Net Profit (₹ Cr), Q2 FY27 (Sep 2026): 0.32
Net Profit Margin (%)
Net Profit Margin (%), Q3 FY25 (Dec 2024): 3.4
Net Profit Margin (%), Q4 FY25 (Mar 2025): 3.0
Net Profit Margin (%), Q2 FY26 (Sep 2025): 2.0
Net Profit Margin (%), Q4 FY26 (Mar 2026): 2.4
Net Profit Margin (%), Q2 FY27 (Sep 2026): 2.0
Metric
CurrentQ2 FY27 (Sep 2026)
PreviousQ4 FY26 (Mar 2026)
Revenue (₹ Cr)
15.64
13.92
Net Profit (₹ Cr)
0.32
0.33
Net Profit Margin (%)
2.0
2.4
Why the profit margin shrank
Two main forces squeezed profitability. First, interest expense jumped 67.9% year-on-year to ₹0.47 crore. According to MCapital, this reflects higher short-term borrowings needed to fund a growing pile of receivables.
Second, other income, which provided a ₹0.17 crore cushion last quarter, collapsed by over 94% to just ₹0.01 crore. This removed a key support for profit before tax, which fell 16% quarter-on-quarter.
The working capital bind
Higher sales did not translate into cash. The research from MCapital indicates the half-year balance sheet showed trade receivables near ₹17.85 crore against H1 revenue of about ₹13.5 crore. This stretched cash conversion cycle is being funded by debt, pushing net debt higher.
Live Chart
· LKMEHTA
(BSE)
ISIN: INE0FFF01017
With a debt-to-equity ratio of 0.97, the balance sheet is leveraged. The company is selling more but collecting slower, a cycle that pressures liquidity unless managed tightly.
Industry headwinds persist
The cost pressure is not unique. A report from PlasInsight notes Indian polymer prices rose in September 2026, with polypropylene and polyethylene grades seeing hikes. For a processor like LK Mehta, this means sustained input cost pressure with limited immediate pass-through ability.
Key Points
Revenue growth of 12.4% quarter-on-quarter was overshadowed by a 3% sequential drop in net profit.
Net profit margin fell 40 basis points due to a 68% year-on-year surge in interest costs and the near-total disappearance of other income.
Working capital intensity increased, with high receivables leading to higher borrowings and a stretched balance sheet.
The company trades at a P/E of 25.1, a 31% discount to the industry average, reflecting the operational challenges.
“
Hexa Perspective
The quarter reveals a business caught between modest top-line growth and intensifying cost pressures. The margin squeeze is structural, driven by higher funding costs for receivables and firm raw material prices.
For profitability to recover, the company must either accelerate collections to reduce borrowing needs or achieve significant operating leverage on higher sales. With the trailing-twelve-month net profit margin at 2.3%, the current 2.0% level suggests the squeeze has room to run if receivables stay high and polymer costs remain firm.
Talk to a HexaWealth advisor, or sync your mutual fund data for insights tailored to your holdings.
Frequently asked questions
What were LK Mehta Polymers' Q2 FY27 results?
LK Mehta Polymers reported Q2 FY27 revenue of ₹15.64 crore, a 2.4% increase year-on-year. Net profit for the September 2026 quarter was ₹0.32 crore, which was 6.7% higher than the same quarter last year but 3% lower than the previous quarter.
Why did LK Mehta Polymers' net profit margin decline in Q2 FY27?
LK Mehta Polymers' net profit margin fell 40 basis points sequentially to 2.0% in Q2 FY27. The decline was primarily due to a 67.9% year-on-year surge in interest expense and a 94% drop in other income compared to the previous quarter, squeezing the bottom line.
What caused the 67.9% year-on-year surge in interest expense for LK Mehta Polymers?
LK Mehta Polymers' interest expense surged 67.9% year-on-year to ₹0.47 crore in Q2 FY27. According to MCapital, this increase is linked to higher short-term borrowings taken to fund rising trade receivables and working capital needs.
Why did LK Mehta Polymers' other income plummet in Q2 FY27?
LK Mehta Polymers' other income fell over 94% year-on-year and quarter-on-quarter to just ₹0.01 crore in Q2 FY27. This followed a quarter where other income was ₹0.17 crore, indicating the previous period's boost was not a recurring run-rate item.
What is the status of LK Mehta Polymers' debt and cash flow?
LK Mehta Polymers has a debt-to-equity ratio of 0.97. Research from MCapital indicates net debt is expected to rise 15-25% over the next year, funded by higher short-term borrowings to support receivables that imply a stretched cash conversion cycle.
What is the current demand and pricing environment for plastic products in India?
The polymer pricing environment remains firm. A PlasInsight report notes Indian polymer prices, including for polypropylene and polyethylene, rose in September 2026. Demand from agro-textile and rope hubs is stable, but cost pressure persists for converters like LK Mehta.
Does LK Mehta Polymers have any ongoing or planned capex for capacity expansion?
Specific capex plans for LK Mehta Polymers were not detailed in the recent results. The company's latest annual report highlights related-party transactions for supply continuity, but no major new capacity expansion was announced alongside the Q2 FY27 numbers.
Has LK Mehta Polymers announced any dividend or buyback plans?
LK Mehta Polymers did not announce any dividend, buyback, or stake sale plans following its Q2 FY27 results. The company has a dividend yield of 0%, and the focus remains on managing working capital and operational performance.
How did LK Mehta Polymers' stock price react to the Q2 FY27 results?
Specific price reaction data for November 14, 2026, is not detailed in the research. However, MCapital's analysis labeled the H1 outcome as having a 'negative' impact, citing weaker sales and stretched receivables pointing to slower growth and higher debt.
What were the analyst estimates for LK Mehta Polymers' Q2 FY27 results?
The research does not cite specific broker estimates for Q2 FY27. However, MCapital provided forward-looking estimates suggesting full-year FY27 revenue and net profit could decline 5-12% and 5-15%, respectively, from the FY26 baseline.
Have any brokerage firms changed their rating for LK Mehta Polymers?
The available research does not mention any specific brokerage rating or target price changes following the Q2 FY27 results. The key concern highlighted by analysis is rising working capital intensity and higher debt.
Are institutional investors increasing their stake in LK Mehta Polymers?
As of September 2026, foreign institutional investors (FIIs) held a 0.21% stake in LK Mehta Polymers, according to MarketsMojo. Promoter holding was stable at 72.92%, with no significant recent changes in institutional ownership disclosed.
LK Mehta Polymers Q2 FY27 results August 2026
LK Mehta Polymers announced its Q2 FY27 results for the quarter ended September 2026 on November 14, 2026. The company reported revenue of ₹15.64 crore and a net profit of ₹0.32 crore for the period.
LK Mehta Polymers Q2 profit drop
LK Mehta Polymers' Q2 FY27 net profit fell 3% sequentially to ₹0.32 crore, despite a 12.4% rise in revenue. The profit drop was due to sharply higher interest costs and a steep decline in other income.
LK Mehta Polymers net profit margin Q2 FY27
LK Mehta Polymers' net profit margin was 2.0% in Q2 FY27, down 40 basis points from the previous quarter. The margin compression was driven by a surge in interest expense and lower other income.