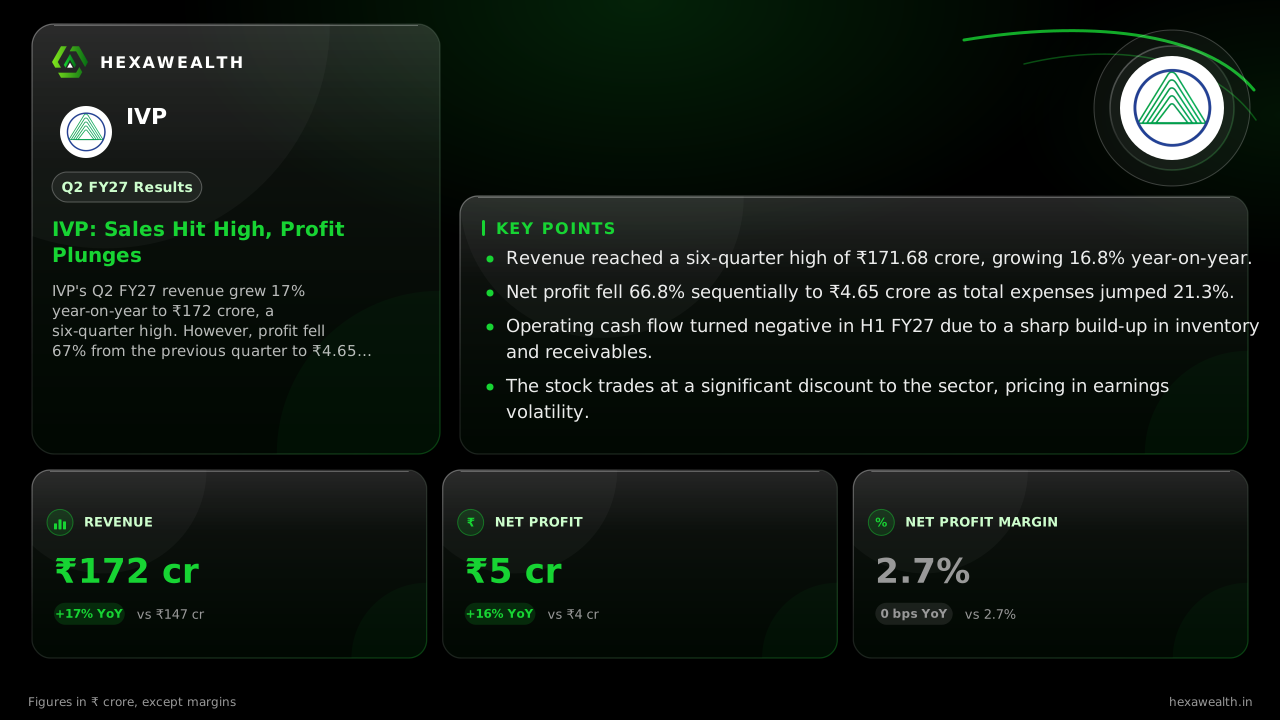
IVP Q2 FY27 Profit Plunges 67% as Costs Swallow Record Sales
IVP posted its highest quarterly revenue in six quarters, but a sharp 21% jump in total expenses caused net profit to plummet sequentially.
IVP's Q2 FY27 revenue grew 17% year-on-year to ₹172 crore, a six-quarter high. However, profit fell 67% from the previous quarter to ₹4.65 crore as total expenses surged, squeezing margins.
For a chemical manufacturer like IVP, the quarter is a story of volume and price. The September quarter delivered strong top-line growth, with revenue hitting a six-quarter high of ₹171.68 crore. Yet the bottom line tells a different story, as profit collapsed by two-thirds from the prior quarter.
Revenue & profit
Revenue (₹ Cr)
Profit (₹ Cr)
Net Profit Margin
| Metric | CurrentQ2 FY27 (Sep '26) | PreviousQ1 FY27 (Jun '26) |
|---|---|---|
| Revenue (₹ Cr) | 171.68 | 154.73 |
| Profit (₹ Cr) | 4.65 | 14.02 |
| Net Profit Margin | 2.7% | 9.1% |
Year-on-year, profit grew 16.3%, closely matching the revenue increase. But the sequential comparison reveals a severe margin squeeze. The net profit margin fell 640 basis points quarter-on-quarter to 2.7%.
Where the money went
Total expenses surged 21.3% from the June quarter, far outpacing the 11% revenue growth. Research from Pokharna Research notes this divergence, where higher sales did not reach profit. The company's operating cash flow also turned negative in the first half, according to a scanx.trade report.
This cash flow shift was attributed to a ₹13 crore increase in inventories and a ₹8.71 crore rise in trade receivables. Working capital absorbed cash faster than earnings were generated, indicating the sales growth came with a liquidity cost.
The outlook and the valuation
Demand in core sectors like foundry and composites remains firm, as noted in a CIE Automotive India earnings call. However, that report also highlighted margin pressure from higher raw material and energy costs, a headwind IVP likely faces. The company's strategy, per an Arthneeti.com report, is to expand its higher-margin polyurethane business using existing land reserves.
The market reaction was muted, with the stock largely flat around the results date. At a P/E of 12.8, IVP trades at a steep 64% discount to the industry average, reflecting the volatility in its quarterly earnings and balance sheet concerns.
Key Points
- Revenue reached a six-quarter high of ₹171.68 crore, growing 16.8% year-on-year.
- Net profit fell 66.8% sequentially to ₹4.65 crore as total expenses jumped 21.3%.
- Operating cash flow turned negative in H1 FY27 due to a sharp build-up in inventory and receivables.
- The stock trades at a significant discount to the sector, pricing in earnings volatility.
Hexa Perspective
This quarter underscores IVP's operational challenge: growth is not translating efficiently into cash or profit. The margin collapse suggests the prior quarter's 9.1% net margin was an outlier, not a new baseline. Investors are weighing robust sector demand against the company's ability to manage working capital and control costs. The path to a sustained re-rating requires proving that sales gains can be captured in the profit statement, not just the balance sheet.
Also read
Want this applied to your portfolio?
Talk to a HexaWealth advisor, or sync your mutual fund data for insights tailored to your holdings.