Icon Facilitators (ICON) Q2 FY27 Swings to Loss as Employee Costs Soar 22%
The facility manager posted a 10% revenue gain but spiraled into a loss as wage inflation crushed margins.
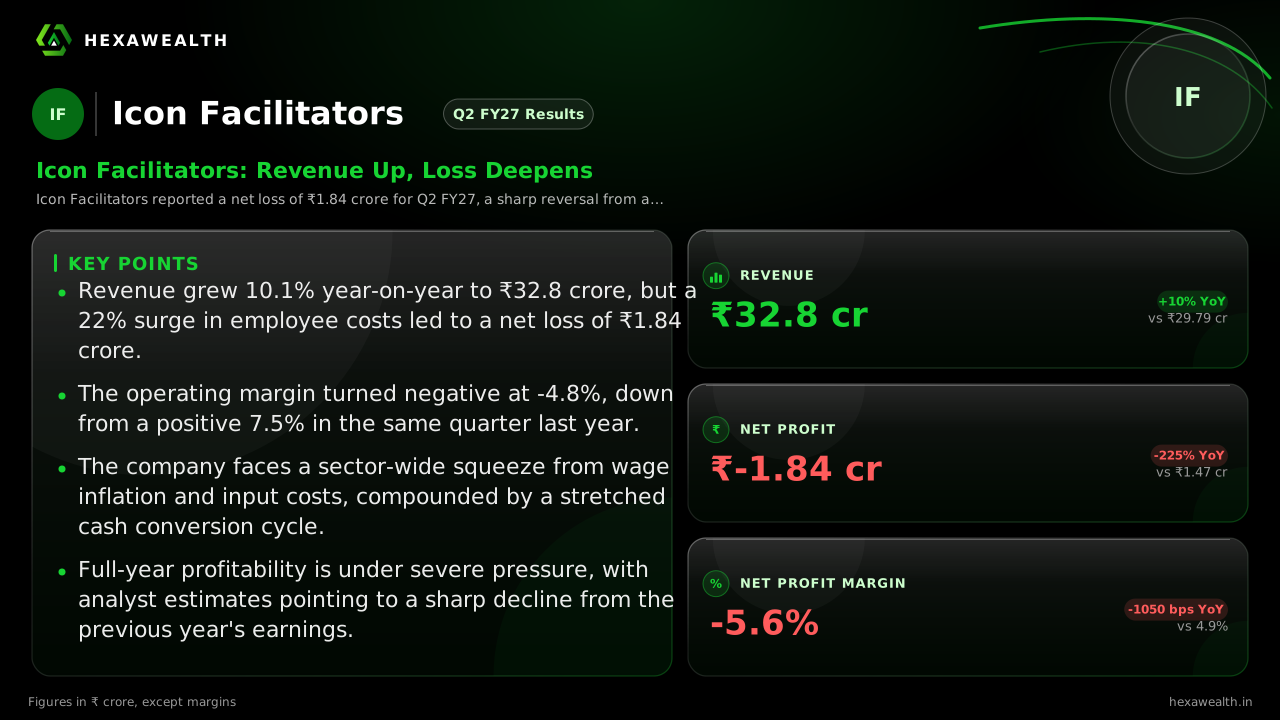
Icon Facilitators reported a net loss of ₹1.84 crore for Q2 FY27, a sharp reversal from a ₹1.47 crore profit a year ago. Revenue grew 10%, but a 22% surge in employee costs pushed the operating margin negative.
For a facilities manager, the equation is straightforward: revenue from contracts must outpace the cost of the people who deliver them. Icon Facilitators' September quarter broke that balance, turning a profitable business into a loss-making one despite higher sales.
Revenue rose 10.1% year-on-year to ₹32.8 crore. Yet total expenses surged 24.5%, led by a 22% jump in employee costs reported by MarketsMojo. The result was a net loss of ₹1.84 crore, a dramatic swing from a ₹1.47 crore profit a year earlier.
Revenue & profit
Revenue (₹ Cr)
Net Profit (₹ Cr)
- Revenue (₹ Cr), Sep 2024 (Q2 FY25): 28.17
- Revenue (₹ Cr), Mar 2025 (Q4 FY25): 29.9
- Revenue (₹ Cr), Sep 2025 (Q2 FY26): 29.79
- Revenue (₹ Cr), Mar 2026 (Q4 FY26): 34.45
- Revenue (₹ Cr), Sep 2026 (Q2 FY27): 32.8
- Net Profit (₹ Cr), Sep 2024 (Q2 FY25): 2.26
- Net Profit (₹ Cr), Mar 2025 (Q4 FY25): 2.21
- Net Profit (₹ Cr), Sep 2025 (Q2 FY26): 1.47
- Net Profit (₹ Cr), Mar 2026 (Q4 FY26): 2.89
- Net Profit (₹ Cr), Sep 2026 (Q2 FY27): -1.84
Revenue (₹ Cr)
- Revenue (₹ Cr), Sep 2024 (Q2 FY25): 28.17
- Revenue (₹ Cr), Mar 2025 (Q4 FY25): 29.9
- Revenue (₹ Cr), Sep 2025 (Q2 FY26): 29.79
- Revenue (₹ Cr), Mar 2026 (Q4 FY26): 34.45
- Revenue (₹ Cr), Sep 2026 (Q2 FY27): 32.8
Net Profit (₹ Cr)
- Net Profit (₹ Cr), Sep 2024 (Q2 FY25): 2.26
- Net Profit (₹ Cr), Mar 2025 (Q4 FY25): 2.21
- Net Profit (₹ Cr), Sep 2025 (Q2 FY26): 1.47
- Net Profit (₹ Cr), Mar 2026 (Q4 FY26): 2.89
- Net Profit (₹ Cr), Sep 2026 (Q2 FY27): -1.84
Net Profit Margin (%)
- Net Profit Margin (%), Sep 2024 (Q2 FY25): 8.0
- Net Profit Margin (%), Mar 2025 (Q4 FY25): 7.4
- Net Profit Margin (%), Sep 2025 (Q2 FY26): 4.9
- Net Profit Margin (%), Mar 2026 (Q4 FY26): 8.4
- Net Profit Margin (%), Sep 2026 (Q2 FY27): -5.6
| Metric | CurrentSep 2026 (Q2 FY27) | PreviousMar 2026 (Q4 FY26) |
|---|---|---|
| Revenue (₹ Cr) | 32.8 | 34.45 |
| Net Profit (₹ Cr) | -1.84 | 2.89 |
| Net Profit Margin (%) | -5.6 | 8.4 |
Why the Profit Vanished
The quarter's story is one of costs outrunning sales. Employee benefit expenses, at ₹32.16 crore, nearly matched the entire quarterly revenue. This 22% year-on-year increase, as noted by mCapital, far exceeded the 10% top-line growth. The operating margin, which was 7.5% a year ago, turned negative at -4.8%.
Depreciation also rose sharply, up 350% year-on-year to ₹0.27 crore. This suggests investment in fixed assets, which Newboard data shows grew significantly in FY26. The only relief was a steep fall in finance costs.
A Sector Squeeze
The pressure is not unique to Icon. Markntel Advisors projects India's facility management market to grow at a 7.3% CAGR through 2033. However, the same report notes that statutory wage revisions and high fuel inflation are pressuring service margins across the organized sector.
Live Chart
· ICON
(BSE)
ISIN: INE0Y0E01012
For Icon, this macro squeeze landed on a business already stretching its working capital. The cash conversion cycle was 124 days in FY26, indicating slower customer payments. An operating cash outflow of ₹3.4 crore for the half-year, per MarketsMojo, shows the strain.
The Path to Recovery
Management has not provided formal guidance. However, mCapital's analysis suggests the H1 loss implies a severe full-year profit contraction of 68-95% from the FY26 baseline of ₹4.42 crore. Recovery hinges on whether the cost surge was a one-time payroll adjustment or a new, higher baseline.
The company's strategy includes a non-binding partnership targeting ₹50 crore in revenue and a move into technical spares trading. Yet, these are future growth levers, not immediate fixes for a profitability crisis.
Key Points
- Revenue grew 10.1% year-on-year to ₹32.8 crore, but a 22% surge in employee costs led to a net loss of ₹1.84 crore.
- The operating margin turned negative at -4.8%, down from a positive 7.5% in the same quarter last year.
- The company faces a sector-wide squeeze from wage inflation and input costs, compounded by a stretched cash conversion cycle.
- Full-year profitability is under severe pressure, with analyst estimates pointing to a sharp decline from the previous year's earnings.
Hexa Perspective
The quarter reveals the fragility of Icon's business model in a tightening cost environment. The company can grow sales, but its profitability is acutely sensitive to wage inflation, a persistent industry trend. The path forward requires either successful cost pass-through in new contracts or significant improvements in workforce productivity.
Investors are left weighing a promising sectoral tailwind against a company-specific profitability shock that has yet to be resolved. The stock's 83% one-year decline reflects this severe disappointment, leaving the valuation at a deep discount to the industry average.
Also read
Want this applied to your portfolio?
Talk to a HexaWealth advisor, or sync your mutual fund data for insights tailored to your holdings.