All posts

Follow Us

LinkedInInstagramX
Quarterly ResultsArchiveLast updated 19 November 20263 min read

VAMA Industries Q2 FY27' Losses Deepen as Revenue Volatility Persists

The IT services firm's Q2 net loss widened to ₹0.72 crore, with revenue down 24% year-on-year, highlighting a struggle for stability.

By Abhinav Singhvi, Founder & CEO Hexawealth · Created 19 November 2026

VAMA Industries reported a net loss of ₹0.72 crore for Q2 FY27, a significant deterioration from the year-ago quarter. Revenue fell 24% YoY to ₹1.50 crore, underscoring extreme volatility in its project-based business model.

For VAMA Industries, a system integrator serving space and defence clients, the September quarter was another chapter in a volatile, loss-making story. The company reported a net loss of ₹0.72 crore, a sharp deterioration from the ₹0.17 crore loss a year ago, even as revenue fell 24% to ₹1.50 crore.

The numbers show a business struggling to find its footing. While revenue jumped 233% from an extremely low base in the June quarter, the year-on-year decline and a net profit margin of -47.8% tell a more consistent tale of distress.

Revenue & profit

Revenue (₹ Cr)

Net Profit (₹ Cr)

Revenue & profitQ2 FY26 1.98, Q3 FY26 3.00, Q4 FY26 6.51, Q1 FY27 0.45, Q2 FY27 1.50. Q2 FY26 -0.17, Q3 FY26 0.12, Q4 FY26 -0.22, Q1 FY27 -1.54, Q2 FY27 -0.72-8-4048Q2 '26Q3 '26Q4 '26Q1 '27Q2 '27
  • Revenue (₹ Cr), Q2 FY26: 1.98
  • Revenue (₹ Cr), Q3 FY26: 3.00
  • Revenue (₹ Cr), Q4 FY26: 6.51
  • Revenue (₹ Cr), Q1 FY27: 0.45
  • Revenue (₹ Cr), Q2 FY27: 1.50
  • Net Profit (₹ Cr), Q2 FY26: -0.17
  • Net Profit (₹ Cr), Q3 FY26: 0.12
  • Net Profit (₹ Cr), Q4 FY26: -0.22
  • Net Profit (₹ Cr), Q1 FY27: -1.54
  • Net Profit (₹ Cr), Q2 FY27: -0.72

Revenue (₹ Cr)

Revenue (₹ Cr)Q2 FY26 1.98, Q3 FY26 3.00, Q4 FY26 6.51, Q1 FY27 0.45, Q2 FY27 1.5002468Q2 '26Q3 '26Q4 '26Q1 '27Q2 '27
  • Revenue (₹ Cr), Q2 FY26: 1.98
  • Revenue (₹ Cr), Q3 FY26: 3.00
  • Revenue (₹ Cr), Q4 FY26: 6.51
  • Revenue (₹ Cr), Q1 FY27: 0.45
  • Revenue (₹ Cr), Q2 FY27: 1.50

Net Profit (₹ Cr)

Net Profit (₹ Cr)Q2 FY26 -0.17, Q3 FY26 0.12, Q4 FY26 -0.22, Q1 FY27 -1.54, Q2 FY27 -0.72-2-1012Q2 '26Q3 '26Q4 '26Q1 '27Q2 '27
  • Net Profit (₹ Cr), Q2 FY26: -0.17
  • Net Profit (₹ Cr), Q3 FY26: 0.12
  • Net Profit (₹ Cr), Q4 FY26: -0.22
  • Net Profit (₹ Cr), Q1 FY27: -1.54
  • Net Profit (₹ Cr), Q2 FY27: -0.72

Net Profit Margin (%)

Net Profit Margin (%)Q2 FY26 -8.5, Q3 FY26 3.9, Q4 FY26 -3.4, Q1 FY27 –, Q2 FY27 -47.8-80%-40%0%40%80%Q2 '26Q3 '26Q4 '26Q1 '27Q2 '27
  • Net Profit Margin (%), Q2 FY26: -8.5
  • Net Profit Margin (%), Q3 FY26: 3.9
  • Net Profit Margin (%), Q4 FY26: -3.4
  • Net Profit Margin (%), Q1 FY27: –
  • Net Profit Margin (%), Q2 FY27: -47.8
MetricCurrentQ2 FY27PreviousQ1 FY27Same quarter LYQ2 FY26
Revenue (₹ Cr)
1.50YoY -24%
0.45
1.98
Net Profit (₹ Cr)
-0.72YoY -324%
-1.54
-0.17
Net Profit Margin (%)
-47.8YoY -462%
–
-8.5

Why the Losses Are Getting Worse

The primary driver is a cost structure that has not adjusted to a shrunken revenue base. According to MarketsMojo, employee costs consumed 45% of total revenue this quarter. Total expenses rose 3.7% year-on-year even as revenue fell, pushing the EBITDA margin to -39.6%, a 25 percentage-point drop from last year.

This points to a project-based business with lumpy revenue recognition rather than recurring cash flows. The company's focus on smaller projects for better cash flow, noted in its business snapshot, has yet to translate into financial stability.

The Cash Burn and Market Sentiment

The financial strain is visible in the cash flow. MarketPing reported an operating cash outflow of ₹1.67 crore for the first half of FY27. This cash burn, alongside persistent losses, has eroded shareholder equity by over ₹2 crore in six months.

Live Chart

· VAMA

(BSE)

ISIN: INE685D01022

The market reaction was muted but negative, with the stock declining 0.29% to ₹3.38 post-results, as noted by MarketsMojo. More telling is the complete absence of institutional investors, a sign of deep skepticism about the company's turnaround prospects.

Key Points

  • VAMA Industries' Q2 FY27 net loss widened to ₹0.72 crore from ₹0.17 crore a year ago, despite a sequential revenue jump from a very low base.
  • A high fixed-cost base, where employee expenses consume nearly half of revenue, led to a severely negative EBITDA margin of -39.6%.
  • The company burned ₹1.67 crore in operating cash during H1 FY27, eroding net worth and highlighting a lack of financial sustainability.
  • With zero institutional ownership and a stock down 38% over the past year, investor confidence in a near-term recovery remains absent.

Hexa Perspective

The quarter underscores a fundamental mismatch between VAMA's cost structure and its volatile revenue stream. While the broader space and defence sector in India is growing, the company has been unable to secure the large, recurring contracts needed to support its operations.

The path to viability requires either a dramatic and sustained increase in project wins or a significant restructuring of fixed costs. Until evidence of either emerges, the pattern of losses consuming equity is likely to continue, making the stock a speculative proposition at best.

Share or follow HexaWealth

Also read

Want this applied to your portfolio?

Talk to a HexaWealth advisor, or sync your mutual fund data for insights tailored to your holdings.
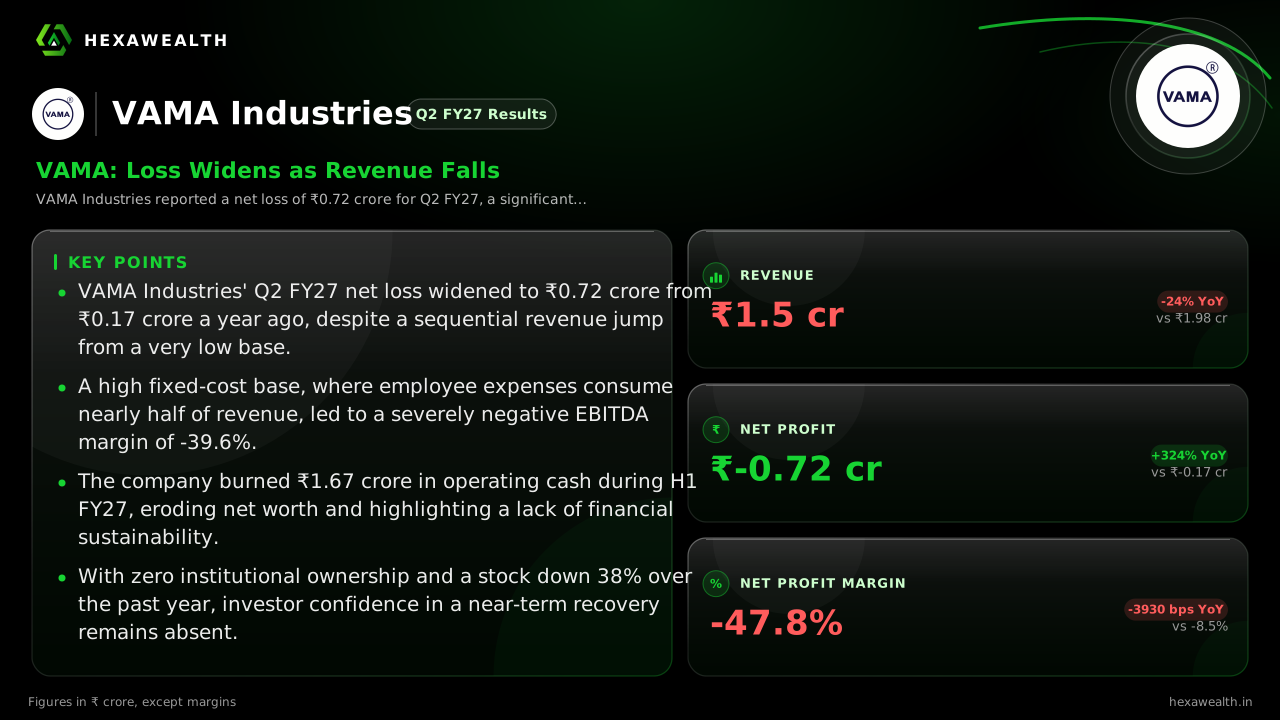
VAMA Industries (VAMA) Q2 FY27 results, revenue and profits.

Frequently asked questions

What were VAMA Industries' Q2 FY27 results?
VAMA Industries reported a net loss of ₹0.72 crore on revenue of ₹1.50 crore for Q2 FY27 (September 2026 quarter). This compares to a net loss of ₹0.17 crore on revenue of ₹1.98 crore in the same quarter last year, marking a significant deterioration in profitability.
Why did VAMA Industries' Q2 FY27 revenue fall 24% year-on-year?
VAMA Industries' revenue fell 24% year-on-year in Q2 FY27 due to the volatile, project-based nature of its IT services business. The company has struggled to secure consistent project flow, leading to sharp swings in quarterly sales from one period to the next.
What drove the 323% YoY 'improvement' in VAMA's Q2 profit when the company still reported a loss?
The 323% year-on-year 'improvement' in VAMA's Q2 profit is a misleading percentage due to a low base. The net loss actually widened from ₹0.17 crore in Q2 FY26 to ₹0.72 crore in Q2 FY27. The large percentage change reflects the deterioration in the loss amount, not an improvement.
Why did VAMA Industries' net profit margin worsen to -47.8% in Q2 FY27?
VAMA Industries' net profit margin worsened to -47.8% because expenses did not fall in line with declining revenue. Total expenses rose 3.7% year-on-year while revenue fell 24%, leading to a much larger loss relative to sales. High fixed costs, particularly employee expenses, were a key factor.
What is VAMA Industries' order book and project pipeline status as of Q2 FY27?
The available research does not provide a specific update on VAMA Industries' order book or project pipeline for Q2 FY27. The company's recent filings and reports focus on its financial results, which show continued revenue volatility and losses.
What guidance did VAMA Industries management provide for FY27?
The research does not cite specific financial guidance from VAMA Industries' management for FY27. A MarketsMojo report notes the company's continued struggle with profitability and the absence of visible catalysts for a turnaround, suggesting a lack of concrete near-term targets.
Is VAMA Industries undertaking any new capacity expansion or capex projects?
VAMA Industries' focus appears to be on cash preservation, not expansion. According to MarketPing data, capital expenditure was just ₹0.04 crore for the first half of FY27. An analysis from mcapital.in suggests the company is assumed to undertake no material capex in the next 12 months.
Did VAMA Industries' Q2 FY27 results beat or miss analyst estimates?
The research does not reference a specific consensus analyst estimate for VAMA Industries' Q2 FY27 results. However, multiple reports characterize the results as very negative, highlighting the widening loss, revenue decline, and ongoing cash burn.
Have any institutional investors changed their stake in VAMA Industries recently?
No, institutional investor participation in VAMA Industries remains at zero. A MarketsMojo analysis shows no holdings by foreign institutional investors, mutual funds, or insurance companies, reflecting a lack of professional investor confidence in the company's prospects.
How did VAMA Industries' stock price react to the Q2 FY27 results?
VAMA Industries' stock price declined 0.29% to ₹3.38 following the Q2 FY27 results announcement on November 14, 2026, as reported by MarketsMojo. This extended a longer-term downtrend, with the stock down 38% over the past year.
VAMA Industries Q2 FY27 results net loss widens
VAMA Industries' Q2 FY27 (September 2026) results showed a net loss of ₹0.72 crore, which widened significantly from a net loss of ₹0.17 crore in Q2 FY26. Revenue for the quarter was ₹1.50 crore, down 24% from the same period last year.
VAMA Industries Q2 FY27 results August 2026
VAMA Industries announced its Q2 FY27 results for the period ending September 2026 on November 14, 2026. The company reported a net loss of ₹0.72 crore on revenue of ₹1.50 crore, representing a deterioration from the year-ago quarter's performance.