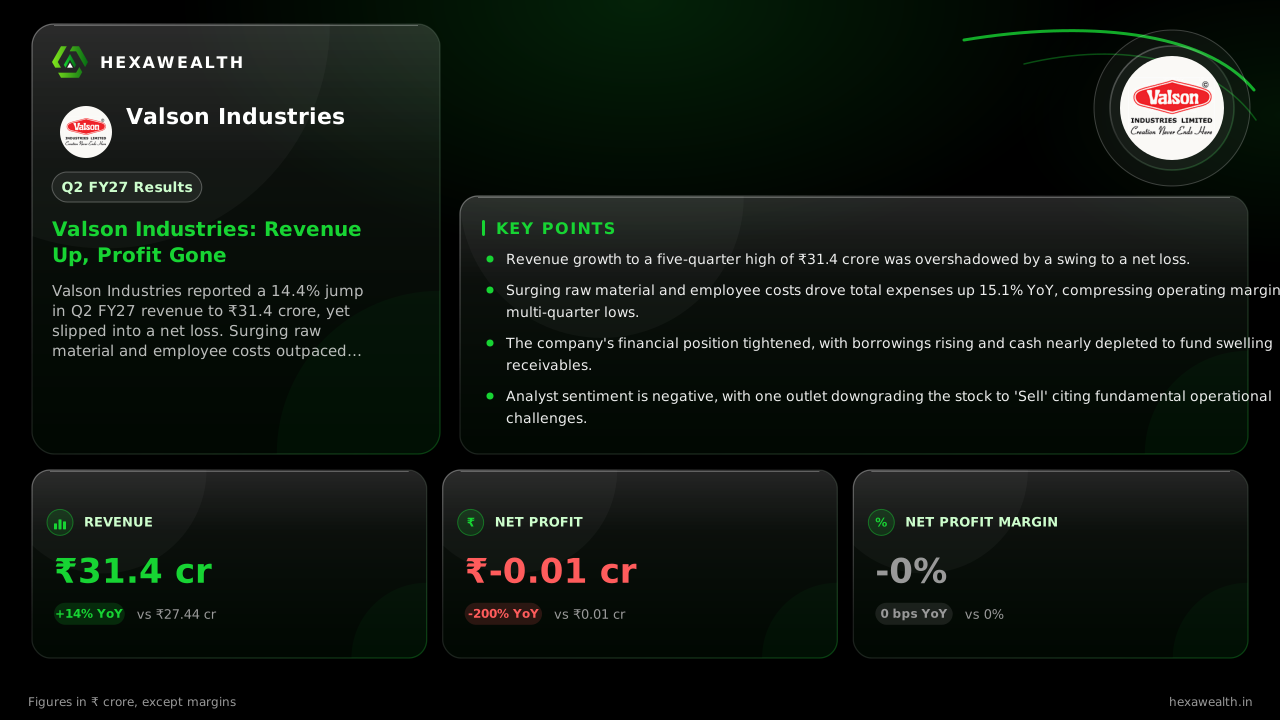
Valson Industries reported a 14.4% jump in Q2 FY27 revenue to ₹31.4 crore, yet slipped into a net loss. Surging raw material and employee costs outpaced sales growth, compressing margins to multi-quarter lows.
For a textile processor like Valson Industries, the quarter is a test of whether it can pass rising input costs to customers. The September quarter showed it could not. Revenue reached a five-quarter high, but profit vanished as expenses ran ahead.
Revenue grew 14.4% year-on-year to ₹31.4 crore, and 9.2% from the June quarter. Yet the company reported a net loss of ₹0.01 crore, compared to a slim profit a year ago and a ₹0.07 crore profit last quarter. The net profit margin turned negative.
Revenue & profit
Revenue (₹ Cr)
Profit (₹ Cr)
Revenue (₹ Cr), Q2 FY26 (Sep 2025): 27.44
Revenue (₹ Cr), Q3 FY26 (Dec 2025): 27.2
Revenue (₹ Cr), Q4 FY26 (Mar 2026): 29.02
Revenue (₹ Cr), Q1 FY27 (Jun 2026): 28.76
Revenue (₹ Cr), Q2 FY27 (Sep 2026): 31.4
Profit (₹ Cr), Q2 FY26 (Sep 2025): 0.01
Profit (₹ Cr), Q3 FY26 (Dec 2025): 0.16
Profit (₹ Cr), Q4 FY26 (Mar 2026): 0.24
Profit (₹ Cr), Q1 FY27 (Jun 2026): 0.07
Profit (₹ Cr), Q2 FY27 (Sep 2026): -0.01
Revenue (₹ Cr)
Revenue (₹ Cr), Q2 FY26 (Sep 2025): 27.44
Revenue (₹ Cr), Q3 FY26 (Dec 2025): 27.2
Revenue (₹ Cr), Q4 FY26 (Mar 2026): 29.02
Revenue (₹ Cr), Q1 FY27 (Jun 2026): 28.76
Revenue (₹ Cr), Q2 FY27 (Sep 2026): 31.4
Profit (₹ Cr)
Profit (₹ Cr), Q2 FY26 (Sep 2025): 0.01
Profit (₹ Cr), Q3 FY26 (Dec 2025): 0.16
Profit (₹ Cr), Q4 FY26 (Mar 2026): 0.24
Profit (₹ Cr), Q1 FY27 (Jun 2026): 0.07
Profit (₹ Cr), Q2 FY27 (Sep 2026): -0.01
Net Profit Margin (%)
Net Profit Margin (%), Q2 FY26 (Sep 2025): 0.0
Net Profit Margin (%), Q3 FY26 (Dec 2025): 0.6
Net Profit Margin (%), Q4 FY26 (Mar 2026): 0.8
Net Profit Margin (%), Q1 FY27 (Jun 2026): 0.2
Net Profit Margin (%), Q2 FY27 (Sep 2026): -0.0
Metric
CurrentQ2 FY27 (Sep 2026)
PreviousQ1 FY27 (Jun 2026)
Revenue (₹ Cr)
31.4
28.76
Profit (₹ Cr)
-0.01
0.07
Net Profit Margin (%)
-0.0
0.2
The cost squeeze that erased gains
Total expenses rose 15.1% year-on-year, faster than revenue. According to MarketPing, the cost of materials jumped 17.8% to ₹19.11 crore. Employee costs also climbed 14.1% sequentially, noted MarketsMojo, indicating wage pressure or inefficiency.
This pushed the operating margin down sharply. The EBITDA margin, reported at 1.9% by MarketPing, fell from 2.8% a year ago. It is the lowest in the last five quarters, a clear trend of margin compression.
A balance sheet under strain
The growth came with a financial strain. Borrowings rose to ₹16.23 crore in six months from ₹14.02 crore, as per the company's filing. Cash dwindled to just ₹0.02 crore.
Live Chart
· VALSONQ
(BSE)
ISIN: INE808A01018
Trade receivables surged about 55% to roughly ₹11.4 crore, according to an mCapital.in analysis, far outpacing sales growth. This points to tighter working capital and the need for more debt to fund operations.
What the market is weighing
No major brokerage has published a rating or target change, reflecting the stock's micro-cap status and lack of institutional coverage. The valuation at a 40% premium to the industry P/E seems disconnected from the vanishing profitability.
MarketsMojo, in a detailed report, downgraded the stock to 'Sell' with a score of 34/100. The report highlights concerns over margin collapse, negligible profitability, and returns well below the cost of capital.
Key Points
Revenue growth to a five-quarter high of ₹31.4 crore was overshadowed by a swing to a net loss.
Surging raw material and employee costs drove total expenses up 15.1% YoY, compressing operating margins to multi-quarter lows.
The company's financial position tightened, with borrowings rising and cash nearly depleted to fund swelling receivables.
Analyst sentiment is negative, with one outlet downgrading the stock to 'Sell' citing fundamental operational challenges.
“
Hexa Perspective
This quarter reveals a business caught between rising demand and an inability to protect its margins. The revenue number is healthy, but it's a hollow victory when every extra rupee of sales costs more than a rupee to produce.
The path forward hinges entirely on cost control or pricing power recovery. With receivables ballooning and borrowings up, the strain on the balance sheet adds another layer of risk. Until there's evidence the margin erosion has stopped, the top-line growth story remains unconvincing.
Talk to a HexaWealth advisor, or sync your mutual fund data for insights tailored to your holdings.
Frequently asked questions
What were Valson Industries' Q2 FY27 results?
Valson Industries reported a net loss of ₹0.01 crore on revenue of ₹31.4 crore for the quarter ended September 2026 (Q2 FY27). Revenue grew 14.4% year-on-year, but profit turned negative from a ₹0.01 crore profit in the same quarter last year.
Why did Valson Industries report a net loss in Q2 FY27 despite revenue growth?
Valson Industries reported a Q2 FY27 loss because total expenses rose 15.1%, outpacing the 14.4% revenue growth. MarketPing reported the cost of materials surged 17.8%, and employee costs also increased significantly, compressing margins.
What caused the sharp QoQ decline in net profit margin for Valson Industries in Q2 FY27?
Valson Industries' net profit margin fell 20 basis points QoQ to -0.0% in Q2 FY27 due to severe operating margin compression. The EBITDA margin narrowed to 1.9% from 2.6% in Q1 FY27, as costs for materials and employees rose faster than sales.
Was Valson Industries' Q2 FY27 performance driven by its Polyester Dyed Yarn or Cotton processing segment?
The company operates in a single 'Yarns' segment, as noted by News Tulsian AI. The consolidated revenue growth of 14.4% in Q2 FY27 is attributed to demand for its core products, including texturised and dyed polyester yarns, according to MarketsMojo.
Did higher raw material costs or lower realisations impact Valson Industries' profitability in Q2 FY27?
Higher raw material costs were a key factor. MarketPing data shows the cost of materials consumed rose 17.8% year-on-year to ₹19.11 crore in Q2 FY27. MarketsMojo suggests the company could not fully pass these increased costs to customers, hurting margins.
What is the status of Valson Industries' working capital and cash flow in Q2 FY27?
Valson Industries' working capital strained in Q2 FY27. Trade receivables jumped about 55% to ~₹11.4 crore per mCapital.in, while cash fell to ₹0.02 crore. For the first half, operating cash flow was negative ₹1.23 crore.
What guidance did Valson Industries management provide for FY27?
The research snippets do not contain specific forward guidance from Valson Industries' management for FY27 following the Q2 results. The company's filing focused on the reported quarterly and half-year numbers.
Is Valson Industries undertaking any capacity expansion or new product launches?
There is no mention of major new capacity expansion or product launches in the Q2 FY27 research. An mCapital.in analysis notes the company continues with small debottlenecking capex, with H1 FY27 capital expenditure at ₹1.56 crore.
What is the order book and export outlook for Valson Industries as of Q2 FY27?
The available research on Valson Industries' Q2 FY27 results does not provide specific details on the current order book position or a breakdown of export outlook.
Did Valson Industries Q2 FY27 results beat or miss analyst estimates?
No specific analyst consensus estimates for Valson Industries' Q2 FY27 are cited in the research. However, an mCapital.in analysis projected a significant decline in annual profit and margins based on the half-year trend.
Which brokerages have changed their rating for Valson Industries after Q2 FY27?
No specific brokerage rating changes are cited post-results. MarketsMojo, an analyst outlet, downgraded Valson Industries to 'Sell' with a score of 34/100, citing margin collapse and weak fundamentals.
Are institutional investors increasing their stake in Valson Industries?
Institutional investor participation remains absent. Shareholding pattern data shows Foreign and Domestic Institutional Investors held 0.00% stake in Valson Industries as of September 2026, unchanged from previous quarters.
What are the main concerns analysts have raised about Valson Industries?
MarketsMojo highlights key concerns: a collapse in operating margins to 1.92%, negligible profitability, and capital returns (ROE of 1.96%) well below the cost of capital. The lack of pricing power and institutional interest are also noted.
Valson Industries Q2 profit drop
Valson Industries' Q2 FY27 profit dropped to a loss of ₹0.01 crore from a profit of ₹0.01 crore in Q2 FY26, a 200% decline. Sequentially, profit fell from ₹0.07 crore in Q1 FY27, a 114.3% drop, due to costs rising faster than sales.
Valson Industries Q2 FY27 results August 2026
Valson Industries announced its Q2 FY27 (September quarter) results on November 14, 2026. For the quarter, it reported revenue of ₹31.4 crore and a net loss of ₹0.01 crore. The results were for the period ended September 30, 2026.