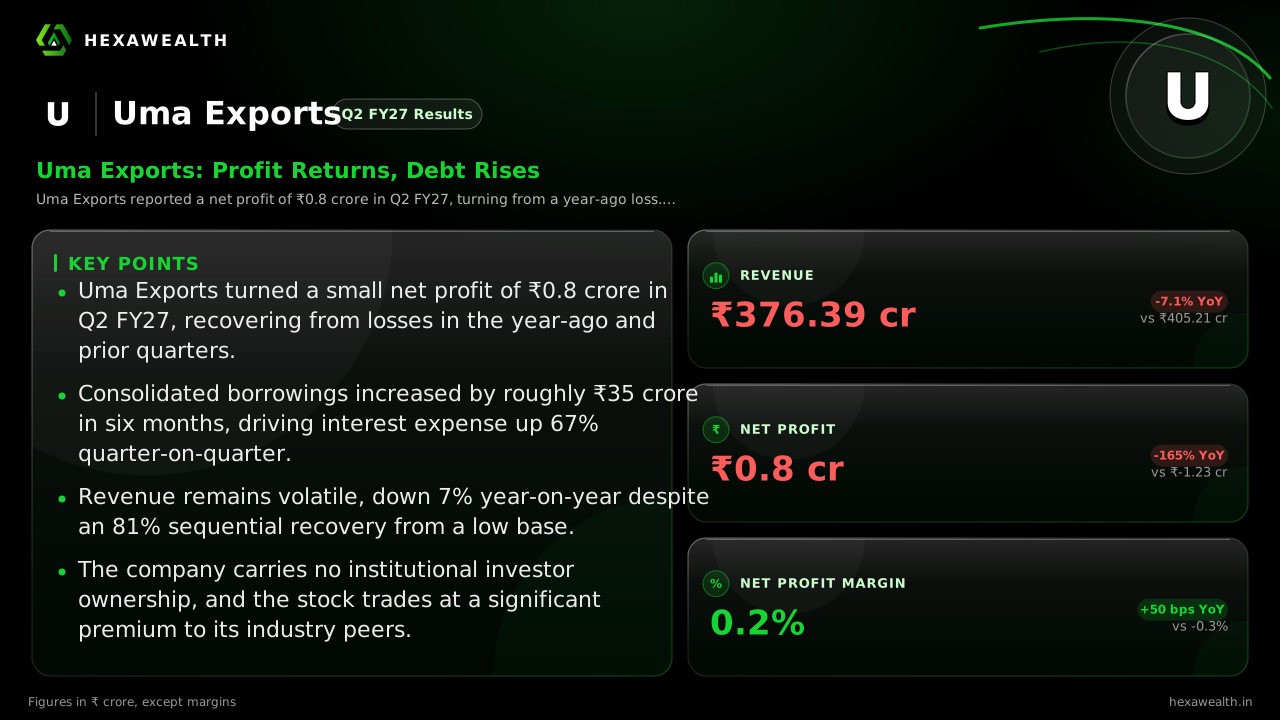
Uma Exports reported a net profit of ₹0.8 crore in Q2 FY27, turning from a year-ago loss. Revenue fell 7% year-on-year but jumped 81% from a weak prior quarter, while debt and interest expenses rose sharply.
For a commodity trader, the story is often in the working capital and the margins between buying and selling. Uma Exports' September quarter delivered a modest profit after last year's loss, but the balance sheet tells a more cautious tale.
The company reported a net profit of ₹0.8 crore, a turnaround from a ₹1.23 crore loss in the same quarter last year. Revenue of ₹376 crore was down 7% year-on-year but surged 81% from a very weak June quarter. The operating profit margin, as calculated by MarketPing, improved to 1.6% from 0.5% a year ago.
Revenue & profit
Revenue (₹ Cr)
Net Profit (₹ Cr)
Revenue (₹ Cr), Q2 FY26 (Sep 2025): 405.21
Revenue (₹ Cr), Q3 FY26 (Dec 2025): 560.44
Revenue (₹ Cr), Q4 FY26 (Mar 2026): 263.93
Revenue (₹ Cr), Q1 FY27 (Jun 2026): 208.41
Revenue (₹ Cr), Q2 FY27 (Sep 2026): 376.39
Net Profit (₹ Cr), Q2 FY26 (Sep 2025): -1.23
Net Profit (₹ Cr), Q3 FY26 (Dec 2025): 1.27
Net Profit (₹ Cr), Q4 FY26 (Mar 2026): 0.37
Net Profit (₹ Cr), Q1 FY27 (Jun 2026): -0.32
Net Profit (₹ Cr), Q2 FY27 (Sep 2026): 0.80
Revenue (₹ Cr)
Revenue (₹ Cr), Q2 FY26 (Sep 2025): 405.21
Revenue (₹ Cr), Q3 FY26 (Dec 2025): 560.44
Revenue (₹ Cr), Q4 FY26 (Mar 2026): 263.93
Revenue (₹ Cr), Q1 FY27 (Jun 2026): 208.41
Revenue (₹ Cr), Q2 FY27 (Sep 2026): 376.39
Net Profit (₹ Cr)
Net Profit (₹ Cr), Q2 FY26 (Sep 2025): -1.23
Net Profit (₹ Cr), Q3 FY26 (Dec 2025): 1.27
Net Profit (₹ Cr), Q4 FY26 (Mar 2026): 0.37
Net Profit (₹ Cr), Q1 FY27 (Jun 2026): -0.32
Net Profit (₹ Cr), Q2 FY27 (Sep 2026): 0.80
Net Profit Margin
Net Profit Margin, Q2 FY26 (Sep 2025): -0.3%
Net Profit Margin, Q3 FY26 (Dec 2025): 0.2%
Net Profit Margin, Q4 FY26 (Mar 2026): 0.1%
Net Profit Margin, Q1 FY27 (Jun 2026): -0.2%
Net Profit Margin, Q2 FY27 (Sep 2026): 0.2%
Metric
CurrentQ2 FY27 (Sep 2026)
PreviousQ1 FY27 (Jun 2026)
Revenue (₹ Cr)
376.39
208.41
Net Profit (₹ Cr)
0.80
-0.32
Net Profit Margin
0.2%
-0.2%
The Cost of a Turnaround
The profit improvement came with a steep rise in financing costs. Interest expense jumped 17% year-on-year and 67% sequentially to ₹5.8 crore. According to mCapital, consolidated borrowings rose to ₹177.7 crore in September from ₹142.5 crore in March, as trade receivables swelled.
This pushed the interest cover to a thin 1.05 times. The company's debt-funded working capital expansion is now a central feature of its operations, tempering the benefit of returning to the black.
A Volatile Trading Environment
The revenue decline from last year points to softer trading volumes in its core sugar and spices business. While global sugar prices are firm due to supply concerns, India's export restrictions have closed a major channel for domestic traders.
Live Chart
· UMAEXPORTS
(BSE)
ISIN: INE0GIU01018
This volatile backdrop makes consistent profitability a challenge. The sharp quarter-on-quarter revenue bounce suggests deal flow is lumpy, not steadily improving.
The Market's Skepticism
Institutional investors remain entirely absent, a point highlighted by MarketsMojo. The stock fell 2% on the results day, reflecting the market's focus on the rising debt burden over the nominal profit.
With a price-to-earnings ratio of 74.8, far above the industry average, the valuation does not account for the financial strain evident in the latest numbers.
Key Points
Uma Exports turned a small net profit of ₹0.8 crore in Q2 FY27, recovering from losses in the year-ago and prior quarters.
Consolidated borrowings increased by roughly ₹35 crore in six months, driving interest expense up 67% quarter-on-quarter.
Revenue remains volatile, down 7% year-on-year despite an 81% sequential recovery from a low base.
The company carries no institutional investor ownership, and the stock trades at a significant premium to its industry peers.
“
Hexa Perspective
The quarter shows a business caught between a cyclical revenue uptick and a structural rise in leverage. The profit turnaround is mathematically positive but economically thin, with interest consuming most of the operating profit.
For the recovery to be sustainable, revenue must not only hold at this higher level but grow enough to improve the interest cover meaningfully. Until then, the balance sheet stress overshadows the income statement improvement, keeping the investment case fragile.
Talk to a HexaWealth advisor, or sync your mutual fund data for insights tailored to your holdings.
Frequently asked questions
What were Uma Exports' Q2 FY27 results?
Uma Exports reported a consolidated net profit of ₹0.8 crore for the September 2026 quarter, turning profitable from a loss of ₹1.23 crore in Q2 FY26. Revenue was ₹376.39 crore, down 7.1% year-on-year but up 80.6% from the previous quarter.
Why did Uma Exports' revenue decline 7% year-on-year in Q2 FY27?
Uma Exports' consolidated revenue fell 7% year-on-year to ₹376.39 crore in Q2 FY27. The standalone revenue decline was steeper at about 20.5%, as reported by Arthneeti, indicating softer trading volumes in its agricultural commodity business compared to the previous year.
What caused Uma Exports' profit before tax to fall 194% year-on-year in Q2 FY27?
The 194% year-on-year decline in profit before tax is a mathematical distortion from moving between loss and profit. Profit before tax was ₹1.09 crore in Q2 FY27 versus a loss of ₹1.15 crore in Q2 FY26. The small profit was pressured by a 16.5% rise in interest costs and a 250% jump in tax expense.
Why did Uma Exports' interest expense increase in Q2 FY27?
Uma Exports' interest expense rose 16.5% year-on-year and 66.9% quarter-on-quarter to ₹5.8 crore in Q2 FY27. This was due to higher borrowings, which increased to ₹177.7 crore in September 2026 from ₹142.5 crore in March 2026, as reported by mCapital, to fund rising trade receivables.
Why did Uma Exports' depreciation expense surge 177% year-on-year in the September 2026 quarter?
Depreciation expense increased to ₹0.54 crore in Q2 FY27 from ₹0.20 crore a year earlier, a 177% rise. The company's fixed assets grew in the prior year, leading to a higher depreciation charge, though the absolute amount remains small relative to revenue.
What was Uma Exports management's commentary on the Q2 FY27 results and outlook?
The company did not publish an earnings-call transcript for Q2 FY27, as noted by Arthneeti. Therefore, there is no formal management commentary on the results or specific outlook for sugar and spice exports from this quarter's reporting.
What is the status of Uma Exports' debt and working capital?
Uma Exports' debt rose significantly, with consolidated borrowings at ₹177.7 crore in September 2026, up from ₹142.5 crore in March 2026, per mCapital. This increased working capital needs, reflected in higher trade receivables, and resulted in a low interest cover of 1.05 times.
What is the current export demand and pricing environment for Indian sugar?
Global sugar prices are under upward pressure due to El Niño and supply concerns, as reported by Coface. However, India has banned sugar exports to protect domestic supply, which closes a major channel for traders like Uma Exports, creating a challenging environment.
Which specific commodity segment drove Uma Exports' Q2 FY27 revenue?
Uma Exports is a trader in sugar, spices, and food grains. The company's filing does not break down segment revenue for Q2 FY27, so the specific driver within these commodities is not disclosed. The overall consolidated revenue was ₹376.39 crore.
Did Uma Exports secure any major export contracts in the September 2026 quarter?
The company's results filings and related announcements for Q2 FY27, tracked by MarketPing, do not mention any new major export contracts or order wins. The report focuses on financial results without highlighting specific new deals.
What were the analyst estimates for Uma Exports Q2 FY27?
There is no available analyst consensus for Uma Exports' quarterly results. FlashFinance notes they do not have consensus estimates and instead measure performance against a company's own historical trend.
Are institutional investors increasing their stake in Uma Exports?
No. Institutional investors have zero stake in Uma Exports. MarketsMojo reports a complete absence of FII and mutual fund holdings, which signals market skepticism about the company's prospects.
How did Uma Exports stock price react to the Q2 FY27 results?
Uma Exports stock fell 2.0% on the reaction day following the Q2 FY27 results filing on November 14, 2026, according to MarketPing. The market focused on the underlying financial stress despite the nominal profit.
Uma Exports Q2 profit drop
Uma Exports did not have a profit drop in Q2 FY27; it reported a net profit of ₹0.8 crore, which was a turnaround from a loss of ₹1.23 crore in Q2 FY26. The year-on-year growth rate of -165% is a mathematical distortion from this shift between loss and profit.
Uma Exports Q2 net profit
Uma Exports reported a consolidated net profit of ₹0.80 crore for the quarter ended September 2026 (Q2 FY27). This compares to a net loss of ₹1.23 crore in the same quarter last year and a loss of ₹0.32 crore in the prior quarter (Q1 FY27).