All posts

Follow Us

LinkedInInstagramX
Quarterly ResultsArchiveLast updated 19 November 20263 min read

Suryaamba Spinning Mills (SURYAAMBA) Q2 FY27 Profit Jumps 65% Even as Revenue Declines

Suryaamba Spinning Mills posted a 64.6% surge in Q2 FY27 net profit to ₹1.3 crore, a sharp recovery from a loss, despite a 3.6% drop in revenue.

By Abhinav Singhvi, Founder & CEO Hexawealth · Created 19 November 2026

Suryaamba Spinning Mills reported a 64.6% year-on-year jump in net profit for Q2 FY27, rebounding from a loss in the prior quarter. The profit growth came from aggressive cost-cutting and margin expansion, even as revenue slipped 3.6%.

For a synthetic yarn spinner, the quarter is a tug-of-war between raw material costs and selling prices. Suryaamba Spinning Mills pulled off a win on the cost side in Q2 FY27, turning a loss into a profit even as its top line continued to shrink.

The numbers show a business in two gears. Revenue of ₹55.55 crore was down 3.6% from last year, but up 12.7% sequentially from a weak Q1. Net profit, however, surged 64.6% year-on-year to ₹1.30 crore, marking a dramatic swing from the ₹0.55 crore loss in the June quarter. The net profit margin expanded to 2.3%.

Revenue & profit

Revenue (₹ Cr)

Profit (₹ Cr)

Revenue & profitQ2 FY26 (Sep 2025) 57.65, Q3 FY26 (Dec 2025) 49.31, Q4 FY26 (Mar 2026) 47.54, Q1 FY27 (Jun 2026) 49.27, Q2 FY27 (Sep 2026) 55.55. Q2 FY26 (Sep 2025) 0.79, Q3 FY26 (Dec 2025) 0.92, Q4 FY26 (Mar 2026) 0.72, Q1 FY27 (Jun 2026) -0.55, Q2 FY27 (Sep 2026) 1.30-80-4004080Q2 '26Q3 '26Q4 '26Q1 '27Q2 '27
  • Revenue (₹ Cr), Q2 FY26 (Sep 2025): 57.65
  • Revenue (₹ Cr), Q3 FY26 (Dec 2025): 49.31
  • Revenue (₹ Cr), Q4 FY26 (Mar 2026): 47.54
  • Revenue (₹ Cr), Q1 FY27 (Jun 2026): 49.27
  • Revenue (₹ Cr), Q2 FY27 (Sep 2026): 55.55
  • Profit (₹ Cr), Q2 FY26 (Sep 2025): 0.79
  • Profit (₹ Cr), Q3 FY26 (Dec 2025): 0.92
  • Profit (₹ Cr), Q4 FY26 (Mar 2026): 0.72
  • Profit (₹ Cr), Q1 FY27 (Jun 2026): -0.55
  • Profit (₹ Cr), Q2 FY27 (Sep 2026): 1.30

Revenue (₹ Cr)

Revenue (₹ Cr)Q2 FY26 (Sep 2025) 57.65, Q3 FY26 (Dec 2025) 49.31, Q4 FY26 (Mar 2026) 47.54, Q1 FY27 (Jun 2026) 49.27, Q2 FY27 (Sep 2026) 55.55020406080Q2 '26Q3 '26Q4 '26Q1 '27Q2 '27
  • Revenue (₹ Cr), Q2 FY26 (Sep 2025): 57.65
  • Revenue (₹ Cr), Q3 FY26 (Dec 2025): 49.31
  • Revenue (₹ Cr), Q4 FY26 (Mar 2026): 47.54
  • Revenue (₹ Cr), Q1 FY27 (Jun 2026): 49.27
  • Revenue (₹ Cr), Q2 FY27 (Sep 2026): 55.55

Profit (₹ Cr)

Profit (₹ Cr)Q2 FY26 (Sep 2025) 0.79, Q3 FY26 (Dec 2025) 0.92, Q4 FY26 (Mar 2026) 0.72, Q1 FY27 (Jun 2026) -0.55, Q2 FY27 (Sep 2026) 1.30-2-1012Q2 '26Q3 '26Q4 '26Q1 '27Q2 '27
  • Profit (₹ Cr), Q2 FY26 (Sep 2025): 0.79
  • Profit (₹ Cr), Q3 FY26 (Dec 2025): 0.92
  • Profit (₹ Cr), Q4 FY26 (Mar 2026): 0.72
  • Profit (₹ Cr), Q1 FY27 (Jun 2026): -0.55
  • Profit (₹ Cr), Q2 FY27 (Sep 2026): 1.30

Net Profit Margin (%)

Net Profit Margin (%)Q2 FY26 (Sep 2025) 1.4, Q3 FY26 (Dec 2025) 1.9, Q4 FY26 (Mar 2026) 1.5, Q1 FY27 (Jun 2026) -1.1, Q2 FY27 (Sep 2026) 2.3-4%-2%0%2%4%Q2 '26Q3 '26Q4 '26Q1 '27Q2 '27
  • Net Profit Margin (%), Q2 FY26 (Sep 2025): 1.4
  • Net Profit Margin (%), Q3 FY26 (Dec 2025): 1.9
  • Net Profit Margin (%), Q4 FY26 (Mar 2026): 1.5
  • Net Profit Margin (%), Q1 FY27 (Jun 2026): -1.1
  • Net Profit Margin (%), Q2 FY27 (Sep 2026): 2.3
MetricCurrentQ2 FY27 (Sep 2026)PreviousQ1 FY27 (Jun 2026)
Revenue (₹ Cr)
55.55
49.27
Profit (₹ Cr)
1.30
-0.55
Net Profit Margin (%)
2.3
-1.1

How Cost-Cut Drove the Turnaround

The profit jump was powered by a sharper fall in expenses than in sales. According to a report by MarketPing, total expenses dropped 5.1% year-on-year to ₹53.94 crore. Employee costs and finance charges fell, even as the cost of materials consumed rose significantly.

The result was a major expansion in operating leverage. MarketsMojo noted the operating margin widened to 7.04%, up 158 basis points from last year and a massive 497-point jump from the previous quarter. This margin push, not sales growth, delivered the bottom-line recovery.

A Recovery Built on Shaky Ground

The question is whether this efficiency gain is sustainable. The broader textile sector faces persistent headwinds, with demand volatility and raw material price swings compressing margins. MarketsMojo highlighted that Suryaamba's five-year sales growth averages a modest 4.74%.

Live Chart

· SURYAAMBA

(BSE)

ISIN: INE360J01011

Furthermore, the company's return metrics remain weak. Its return on equity was just 2.92% for the period, well below the cost of capital. The stock's 5% jump on results day, as reported by MarketPing, suggests relief at the profit return, but the one-year price return of -17.9% reflects deeper, unresolved concerns.

Key Points

  • Net profit rebounded sharply to ₹1.30 crore, up 64.6% year-on-year, reversing a loss from the prior quarter.
  • Revenue continued to contract, falling 3.6% from the same quarter last year to ₹55.55 crore.
  • The profit recovery was driven entirely by cost management, with total expenses falling faster than sales.
  • Structural challenges in the textile sector and weak return metrics cloud the sustainability of this margin-led recovery.

Hexa Perspective

The quarter tells a story of tactical cost control winning a battle, but not the war. Suryaamba proved it can squeeze profitability from a smaller revenue base, a crucial skill in a tough market. Yet, the core issue of stagnant top-line growth remains unaddressed.

For the recovery to last, the company needs its 43,632 spindles to run fuller, driving operating leverage from both sides of the equation. Until revenue finds a durable upward path, the impressive margin expansion of Q2 FY27 risks being a one-quarter wonder, not a new trend.

Share or follow HexaWealth

Also read

Want this applied to your portfolio?

Talk to a HexaWealth advisor, or sync your mutual fund data for insights tailored to your holdings.
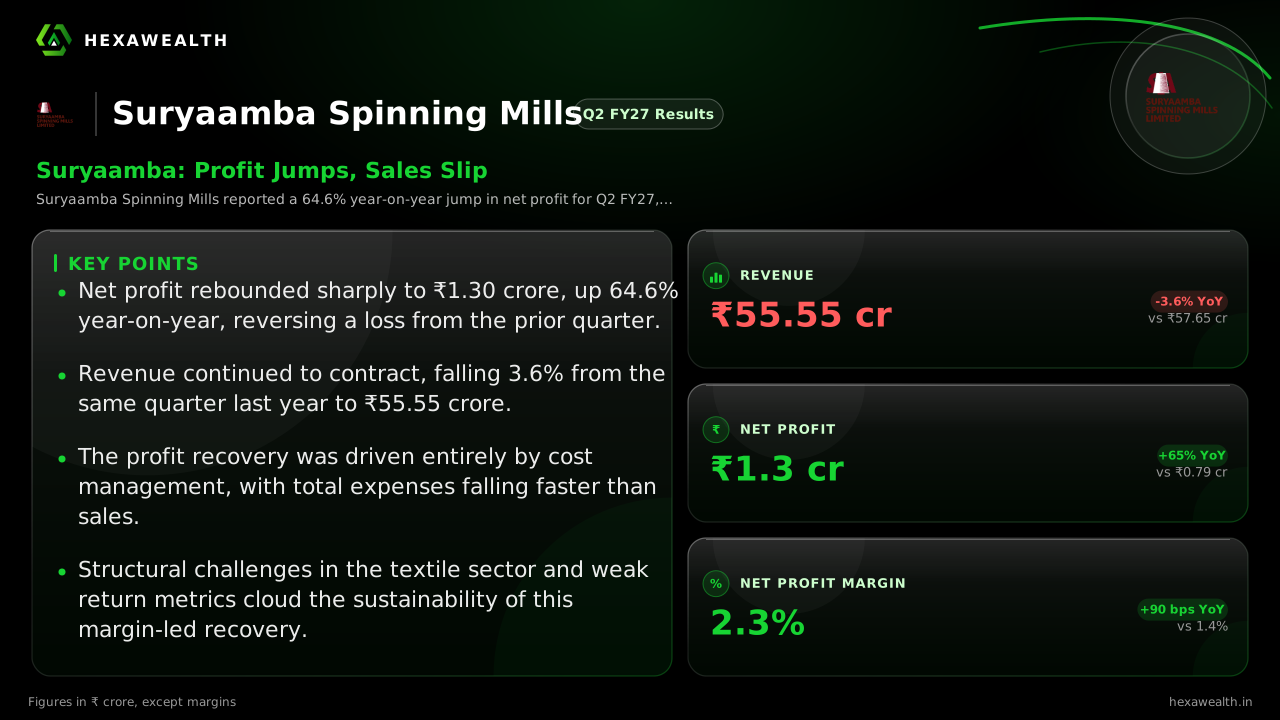
Suryaamba Spinning Mills (SURYAAMBA) Q2 FY27 results, revenue and profits.

Frequently asked questions

What were Suryaamba Spinning Mills' Q2 FY27 results?
Suryaamba Spinning Mills reported Q2 FY27 revenue of ₹55.55 crore, a 3.6% decline from the year-ago quarter. Net profit was ₹1.30 crore, a 64.6% increase year-on-year, marking a sharp recovery from a loss in Q1 FY27.
Why did Suryaamba Spinning Mills' revenue decline year-over-year in Q2 FY27?
Suryaamba's Q2 FY27 revenue fell 3.6% year-on-year to ₹55.55 crore, extending a pattern of top-line pressure. Reports from MarketsMojo attribute this to broader sector challenges like demand volatility and intense competition in the synthetic yarn market.
What drove the 64.6% year-over-year profit growth for Suryaamba Spinning Mills in Q2 FY27?
Suryaamba's profit jumped 64.6% in Q2 FY27 primarily due to aggressive cost-cutting. According to MarketPing, total expenses fell 5.1% year-on-year, led by lower employee and finance costs, which expanded operating margins significantly despite lower sales.
What caused Suryaamba Spinning Mills to swing from a loss in Q1 FY27 to a profit in Q2 FY27?
Suryaamba swung to a ₹1.30 crore profit in Q2 from a ₹0.55 crore loss in Q1 due to a 12.7% sequential revenue increase and drastic margin improvement. MarketsMojo reported the operating margin expanded by 497 basis points quarter-on-quarter, driven by better cost management.
Why did Suryaamba Spinning Mills' tax expense increase by 86.7% year-over-year in Q2 FY27?
Suryaamba's tax expense rose 86.7% to ₹0.43 crore in Q2 FY27 because its profit before tax increased by 68.9%. The higher tax is a function of a larger taxable income base compared to the year-ago quarter.
What guidance did Suryaamba Spinning Mills management provide for FY27 after the Q2 results?
Specific management guidance for FY27 was not detailed in the results filings. However, a MarketsMojo report outlines key watchpoints for the company, including the ability to sustain 7%+ operating margins and return to positive revenue growth.
What is the current demand and pricing environment for synthetic spun yarn in India?
The synthetic yarn market faces volatility. A Fibre2Fashion report from November 2026 notes polyester and viscose yarn prices declined amid sluggish demand and payment constraints downstream, creating a challenging pricing environment for spinners like Suryaamba.
What is Suryaamba Spinning Mills' current order book and capacity utilization?
The Q2 results filing did not disclose the current order book. The company has a production capacity of 30 metric tonnes per day across 43,632 spindles, as noted by MarketsMojo, but the specific utilization rate for the quarter was not provided.
Is Suryaamba Spinning Mills undertaking any capacity expansion or modernization capex?
There is no major expansion capex indicated recently. A MarketsMojo analysis of the balance sheet suggested minimal capital expenditure beyond maintenance, with fixed assets largely unchanged year-on-year as of March 2026.
How did Suryaamba Spinning Mills' stock price react to the Q2 FY27 results announcement?
According to MarketPing, Suryaamba's stock rose 5.0% on the reaction day following the Q2 FY27 results announcement. This outperformed the median sector move, which fell 0.5%, indicating a positive market response to the profit recovery.
Suryaamba Spinning Mills Q2 profit drop
Suryaamba Spinning Mills did not see a profit drop in Q2 FY27. On the contrary, its net profit increased by 64.6% year-on-year to ₹1.30 crore, representing a strong recovery from a loss in the previous quarter.
Suryaamba Spinning Mills Q2 net profit
Suryaamba Spinning Mills reported a standalone net profit of ₹1.30 crore for Q2 FY27 (quarter ended September 2026). This was a significant increase from ₹0.79 crore in the same quarter last year.