Safa Systems (SSTL) Profit Triples in Q4 FY26 as Cash Flow Turns Deeply Negative
The Kerala distributor's net profit surged 100% year-on-year in the March quarter, but a steep rise in receivables drained operating cash.
Safa Systems & Technologies reported a 100% jump in Q4 net profit despite modest revenue growth. The earnings surge, however, was shadowed by a sharp negative turn in operating cash flow due to ballooning receivables.
For a distributor like Safa Systems, the balance between sales growth and cash collection defines its health. The March quarter delivered a stark split, with profit tripling while cash flow turned deeply negative.
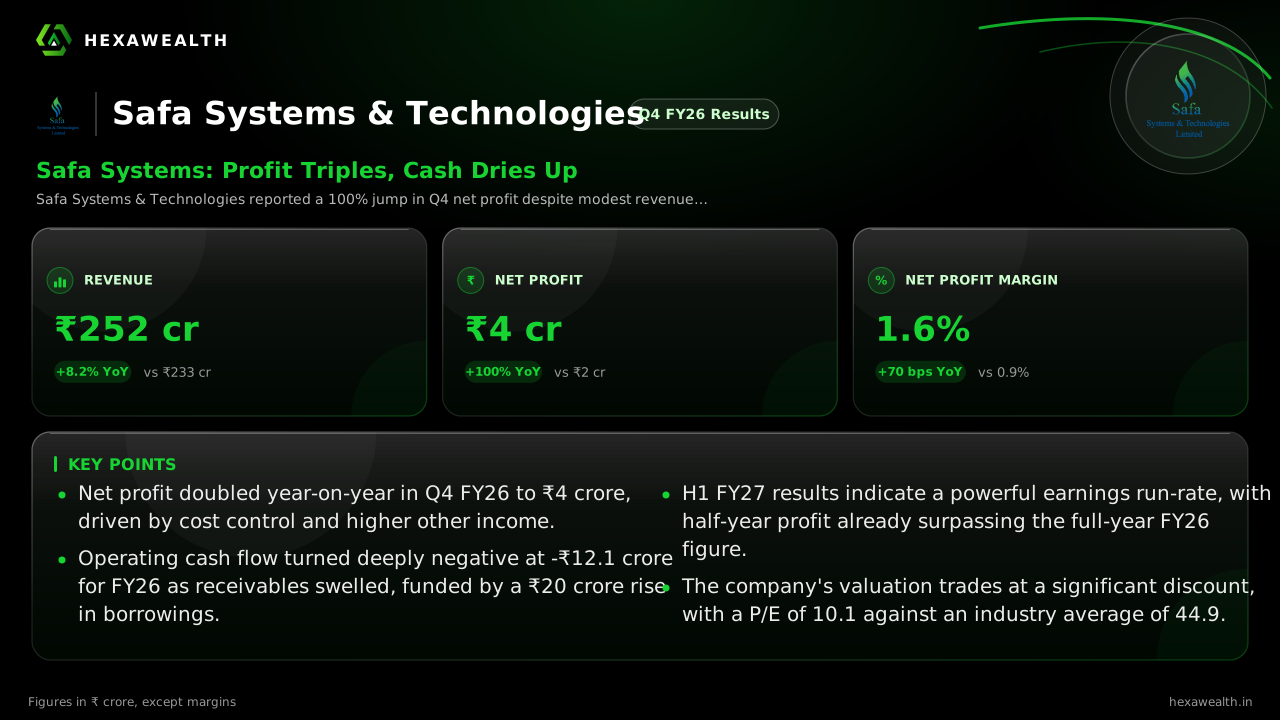
The numbers show a business pushing volume. Revenue for Q4 FY26 was ₹252 crore, up 8.2% from a year ago and a sharp 39% jump from the previous quarter. Net profit quadrupled sequentially to ₹4 crore, doubling year-on-year. This lifted the full-year profit by 25% to ₹4.75 crore, even as annual revenue contracted by 17%.
Revenue & profit
Revenue (₹ Cr)
Profit (₹ Cr)
- Revenue (₹ Cr), Q4 FY24: 385.0
- Revenue (₹ Cr), Q2 FY25: 286.0
- Revenue (₹ Cr), Q4 FY25: 233.0
- Revenue (₹ Cr), Q2 FY26: 181.0
- Revenue (₹ Cr), Q4 FY26: 252.0
- Profit (₹ Cr), Q4 FY24: 1.0
- Profit (₹ Cr), Q2 FY25: 2.0
- Profit (₹ Cr), Q4 FY25: 2.0
- Profit (₹ Cr), Q2 FY26: 1.0
- Profit (₹ Cr), Q4 FY26: 4.0
Revenue (₹ Cr)
- Revenue (₹ Cr), Q4 FY24: 385.0
- Revenue (₹ Cr), Q2 FY25: 286.0
- Revenue (₹ Cr), Q4 FY25: 233.0
- Revenue (₹ Cr), Q2 FY26: 181.0
- Revenue (₹ Cr), Q4 FY26: 252.0
Profit (₹ Cr)
- Profit (₹ Cr), Q4 FY24: 1.0
- Profit (₹ Cr), Q2 FY25: 2.0
- Profit (₹ Cr), Q4 FY25: 2.0
- Profit (₹ Cr), Q2 FY26: 1.0
- Profit (₹ Cr), Q4 FY26: 4.0
Net Profit Margin
- Net Profit Margin, Q4 FY24: 0.3%
- Net Profit Margin, Q2 FY25: 0.7%
- Net Profit Margin, Q4 FY25: 0.9%
- Net Profit Margin, Q2 FY26: 0.6%
- Net Profit Margin, Q4 FY26: 1.6%
| Metric | CurrentQ4 FY26 | Same quarter LYQ4 FY25 |
|---|---|---|
| Revenue (₹ Cr) | 252.0YoY +8.2% | 233.0 |
| Profit (₹ Cr) | 4.0YoY +100% | 2.0 |
| Net Profit Margin | 1.6%YoY +78% | 0.9% |
The cost squeeze that lifted profit
Profit growth far outpaced sales because costs were tightly managed. According to mcapital.in, the improvement was driven by better cost efficiencies. Total expenses rose only 7.7% year-on-year in Q4, less than the revenue increase, allowing more to fall to the bottom line.
A doubling of other income to ₹4 crore also provided a meaningful boost. The net profit margin expanded to 1.6%, its highest in the last five quarters.
The cash trade-off for growth
This profitability came at a cost to the balance sheet. Operating cash flow for the full year FY26 swung to an outflow of ₹12.1 crore from an inflow of ₹5.6 crore the prior year. The reason is clear in the working capital numbers.
Live Chart
· SSTL
(BSE)
ISIN: INE0JNA01014
Trade receivables jumped by ₹8.8 crore over the year. A report from Millionshq.com notes the negative cash flow was due to rising receivables, indicating the company is funding sales growth by extending more credit to customers. Borrowings rose by ₹20 crore to ₹59.5 crore to bridge this gap.
What the market is watching next
The immediate future appears strong based on the first half of the new fiscal year. Data from mcapital.in shows H1 FY27 consolidated revenue hit ₹267 crore, already 62% of FY26's full-year sales. Profit for the half-year was ₹6.6 crore, exceeding the entire profit of the previous year.
This suggests the profit momentum is continuing. However, it is being funded by even more debt, with borrowings rising further to ₹74.6 crore by September 2026. The sustainability of this model hinges on converting those receivables into cash.
Key Points
- Net profit doubled year-on-year in Q4 FY26 to ₹4 crore, driven by cost control and higher other income.
- Operating cash flow turned deeply negative at -₹12.1 crore for FY26 as receivables swelled, funded by a ₹20 crore rise in borrowings.
- H1 FY27 results indicate a powerful earnings run-rate, with half-year profit already surpassing the full-year FY26 figure.
- The company's valuation trades at a significant discount, with a P/E of 10.1 against an industry average of 44.9.
Hexa Perspective
The quarter frames Safa Systems' central tension: impressive profit growth built on a foundation of increasing financial leverage. The 45% five-year profit CAGR shows the company can extract more from each rupee of sales, a positive in a thin-margin distribution business. Yet, the cash conversion cycle is moving the wrong way. The cash flow deficit and rising debt mean this profit surge is not yet self-funding. Investors are weighing the demonstrated earnings power against the risk that working capital demands eventually constrain growth or amplify a downturn.
Also read
Want this applied to your portfolio?
Talk to a HexaWealth advisor, or sync your mutual fund data for insights tailored to your holdings.