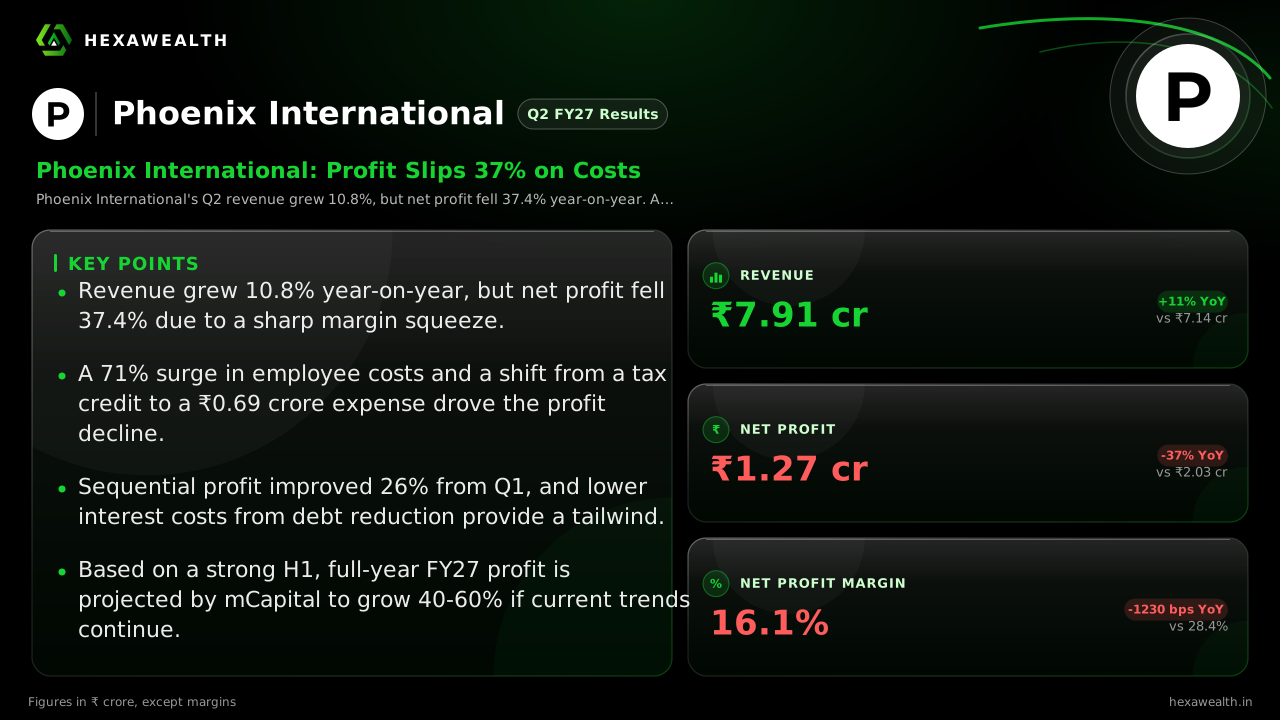
The building leasing firm's Q2 profit fell sharply year-on-year as higher employee costs and a normalized tax bill squeezed margins, despite a sequential recovery.
Phoenix International's Q2 revenue grew 10.8%, but net profit fell 37.4% year-on-year. A surge in employee costs and a shift from a tax credit to an expense drove the drop, though profit improved sequentially from a weak Q1.
For Phoenix International, a company built on leasing buildings and manufacturing shoe uppers, the September quarter delivered a jarring split. Revenue from operations grew a healthy 10.8% year-on-year to ₹7.91 crore, but net profit collapsed by 37.4% to ₹1.27 crore. The story is one of rising costs and a tax bill that reversed last year's benefit, squeezing the bottom line even as the top line expanded.
Revenue & profit
Revenue (₹ Cr)
Profit (₹ Cr)
Revenue (₹ Cr), Q2 FY26 (Sep 2025): 7.14
Revenue (₹ Cr), Q3 FY26 (Dec 2025): 6.76
Revenue (₹ Cr), Q4 FY26 (Mar 2026): 7.42
Revenue (₹ Cr), Q1 FY27 (Jun 2026): 7.65
Revenue (₹ Cr), Q2 FY27 (Sep 2026): 7.91
Profit (₹ Cr), Q2 FY26 (Sep 2025): 2.03
Profit (₹ Cr), Q3 FY26 (Dec 2025): 0.21
Profit (₹ Cr), Q4 FY26 (Mar 2026): -0.48
Profit (₹ Cr), Q1 FY27 (Jun 2026): 1.01
Profit (₹ Cr), Q2 FY27 (Sep 2026): 1.27
Revenue (₹ Cr)
Revenue (₹ Cr), Q2 FY26 (Sep 2025): 7.14
Revenue (₹ Cr), Q3 FY26 (Dec 2025): 6.76
Revenue (₹ Cr), Q4 FY26 (Mar 2026): 7.42
Revenue (₹ Cr), Q1 FY27 (Jun 2026): 7.65
Revenue (₹ Cr), Q2 FY27 (Sep 2026): 7.91
Profit (₹ Cr)
Profit (₹ Cr), Q2 FY26 (Sep 2025): 2.03
Profit (₹ Cr), Q3 FY26 (Dec 2025): 0.21
Profit (₹ Cr), Q4 FY26 (Mar 2026): -0.48
Profit (₹ Cr), Q1 FY27 (Jun 2026): 1.01
Profit (₹ Cr), Q2 FY27 (Sep 2026): 1.27
Net Profit Margin
Net Profit Margin, Q2 FY26 (Sep 2025): 28.4%
Net Profit Margin, Q3 FY26 (Dec 2025): 3.1%
Net Profit Margin, Q4 FY26 (Mar 2026): -6.5%
Net Profit Margin, Q1 FY27 (Jun 2026): 13.2%
Net Profit Margin, Q2 FY27 (Sep 2026): 16.1%
Metric
CurrentQ2 FY27 (Sep 2026)
PreviousQ1 FY27 (Jun 2026)
Revenue (₹ Cr)
7.91
7.65
Profit (₹ Cr)
1.27
1.01
Net Profit Margin
16.1%
13.2%
The table shows a clear sequential recovery from the March quarter loss, with profit up 26% from Q1. Yet the year-on-year comparison reveals a severe margin contraction of 1,230 basis points. According to MarketsMojo, the rental segment drove most of the profit, while manufacturing remained a small contributor.
Why the Profit Fell
Two items explain the dramatic YoY profit drop. First, employee costs surged 71.2%, a significant operational headwind. Second, and more impactful, was a swing in tax. The company booked a tax expense of ₹0.69 crore this quarter, compared to a tax credit of ₹0.50 crore in Q2 FY26. MarketsMojo notes this reflects a return to a normalized tax rate after periods of volatile, high provisions.
Interest costs fell 27.9% year-on-year, a positive from ongoing debt reduction. But this saving was more than offset by the other cost pressures. The net profit margin of 16.1%, while an improvement from the prior quarter, remains far below the 28.4% achieved a year ago.
Live Chart
· PHOENXINTL
(BSE)
ISIN: INE245B01011
The Path from Here
The first half of FY27 sets a base for the full year. According to analysis from mCapital, H1 revenue of ₹15.83 crore annualises to roughly ₹31.5 crore, implying a 12-15% growth over FY26. More notably, H1 profit before tax already exceeds the full-year run-rate from last year. The report suggests FY27 net profit could rise 40-60% if the current momentum holds.
This outlook hinges on stable rental income and continued finance cost control. However, the company's return ratios remain weak, with an ROE of just 2.73%. The stock, trading at a 46.5% discount to the industry P/E, reflects deep market skepticism about the quality and sustainability of earnings.
Key Points
Revenue grew 10.8% year-on-year, but net profit fell 37.4% due to a sharp margin squeeze.
A 71% surge in employee costs and a shift from a tax credit to a ₹0.69 crore expense drove the profit decline.
Sequential profit improved 26% from Q1, and lower interest costs from debt reduction provide a tailwind.
Based on a strong H1, full-year FY27 profit is projected by mCapital to grow 40-60% if current trends continue.
“
Hexa Perspective
The quarter presents a tale of two trends. Operationally, there is stabilization: revenue is growing sequentially, interest costs are falling, and the company is emerging from a period of losses. Yet structurally, profitability remains under severe pressure from elevated costs and volatile tax outcomes.
The projected full-year growth is promising but contingent on the rental segment maintaining its strength and costs not inflating further. Investors are weighing the sequential recovery against persistently low return on capital. Until the company demonstrates it can convert top-line growth into durable, high-quality earnings, the significant valuation discount is likely to persist.
Talk to a HexaWealth advisor, or sync your mutual fund data for insights tailored to your holdings.
Frequently asked questions
What were Phoenix International's Q2 FY27 results?
For Q2 FY27 (September 2026), Phoenix International reported revenue of ₹7.91 crore, up 10.8% year-on-year. Net profit was ₹1.27 crore, a decline of 37.4% from the same quarter last year. Profit showed a 25.7% sequential improvement from the previous quarter.
Why did Phoenix International's net profit fall 37.4% year-on-year in Q2 FY27 despite a 10.8% rise in revenue?
Phoenix International's Q2 FY27 profit fell sharply due to a major margin squeeze. Employee costs surged 71.2% year-on-year, and the company recorded a tax expense of ₹0.69 crore versus a tax credit of ₹0.50 crore in Q2 FY26. These costs overwhelmed the benefit of lower interest expenses.
What caused the 1230 basis point year-on-year contraction in Phoenix International's net profit margin in Q2 FY27?
The 1230 bps YoY margin contraction to 16.1% was driven by two factors. A massive 71.2% increase in employee costs raised operational expenses. Crucially, a normalized tax expense of ₹0.69 crore this quarter replaced a tax credit of ₹0.50 crore in the year-ago period, as noted by MarketsMojo.
Did Phoenix International's real estate leasing or shoe upper manufacturing division drive the Q2 FY27 revenue growth?
The rental services segment was the primary profit driver for Phoenix International in Q2 FY27, according to mCapital. The company's building leasing operations contributed significantly more to earnings than its smaller shoe upper manufacturing division.
Why did Phoenix International's employee cost surge 71.2% year-on-year in Q2 FY27?
Phoenix International's employee cost rose 71.2% to ₹0.57 crore in Q2 FY27 from ₹0.33 crore a year ago. The specific reason for this sharp increase was not detailed in the results announcement, but it represents a major operational cost pressure for the quarter.
Why was Phoenix International's tax expense ₹0.69 crore in Q2 FY27 compared to a tax credit of ₹0.50 crore in Q2 FY26?
The tax swing from a credit to an expense significantly hurt profits. MarketsMojo attributes this to a return to a normalised tax rate of about 35% in Q2 FY27, following quarters with exceptionally high tax provisions. The year-ago credit was an anomaly that flattered the prior period's profit.
What explains the 201.5% quarter-on-quarter jump in other income for Phoenix International in Q2 FY27?
Phoenix International's other income rose 201.5% QoQ to ₹0.20 crore in Q2 FY27 from ₹0.07 crore in Q1. While the filing does not specify the source, such a large sequential jump in non-operational income provided a boost to total income for the quarter.
What is the status of Phoenix International's debt and interest coverage, given its interest cover ratio of 1.99?
Phoenix International's interest coverage ratio stands at 1.99x, indicating earnings barely cover interest costs. However, the company has been reducing debt; long-term borrowings fell to ₹27.3 crore in H1 FY27 from ₹35.24 crore in March 2026. This deleveraging helped lower interest costs by 27.9% YoY in Q2.
What guidance did Phoenix International management provide for FY27 during the Q2 results?
While no formal guidance was cited in the concall, analysis by mCapital projects a strong FY27 based on H1 performance. They estimate full-year revenue could grow 12.7-14.5% and net profit could rise 40-60%, provided the first-half run-rate continues.
Did Phoenix International's Q2 FY27 results beat or miss analyst estimates?
Specific analyst estimates for Q2 were not published. However, mCapital's analysis suggests the strong first-half performance puts FY27 on track for significant growth versus FY26, implying the results may be viewed positively in the context of full-year projections.
How did Phoenix International's stock price react on the day of the Q2 FY27 results announcement?
On the results day (November 14, 2026), Phoenix International's stock price saw a muted reaction. A MarketsMojo alert noted the stock was down 0.25% shortly after the announcement, trading around ₹35.25 compared to a pre-alert price of ₹35.34.
Phoenix International Q2 profit drop
Phoenix International's Q2 FY27 net profit dropped 37.4% year-on-year to ₹1.27 crore. The decline was caused by a sharp increase in employee costs and a swing from a tax credit to a tax expense, which squeezed margins despite a 10.8% rise in revenue.
Phoenix International Q2 FY27 results net profit
Phoenix International reported a net profit of ₹1.27 crore for Q2 FY27 (September 2026 quarter). This represents a 37.4% decrease from the ₹2.03 crore profit in Q2 FY26, but a 25.7% increase from the ₹1.01 crore profit in the preceding Q1 FY27.