All posts

Follow Us

LinkedInInstagramX
Quarterly ResultsArchiveLast updated 22 November 20263 min read

Vruddhi Engineering (VRUDDHI) Q2 FY27 Profit Falls 9% Despite 60% Revenue Jump

The rebar coupler specialist's Q2 FY27 saw a sharp margin squeeze as input and employee costs rose faster than sales, while debt fell.

By Abhinav Singhvi, Founder & CEO Hexawealth · Created 16 November 2026

Vruddhi Engineering's Q2 FY27 revenue surged 59.6% year-on-year, but net profit fell 8.5%. A sharp rise in input and employee expenses compressed margins, with the net profit margin contracting 340 basis points.

For a rebar coupler maker riding India's infrastructure wave, the September quarter delivered a jarring split. Vruddhi Engineering Works posted a 60% year-on-year revenue surge, yet its net profit shrank by nearly 9%. The top line won, but profitability lost decisively.

The numbers tell a clear story of pressure. Revenue reached ₹21.38 crore, but net profit was just ₹0.97 crore. The net profit margin fell to 4.5%, a 340-basis-point drop from the same quarter last year. Sequentially, the decline from a blockbuster March quarter was even steeper.

Revenue & profit

Revenue (₹ Cr)

Profit (₹ Cr)

Revenue & profitQ2 FY25 (Sep 2024) 13.83, Q4 FY25 (Mar 2025) 17.97, Q2 FY26 (Sep 2025) 13.40, Q4 FY26 (Mar 2026) 29.60, Q2 FY27 (Sep 2026) 21.38. Q2 FY25 (Sep 2024) 0.39, Q4 FY25 (Mar 2025) 1.10, Q2 FY26 (Sep 2025) 1.06, Q4 FY26 (Mar 2026) 2.02, Q2 FY27 (Sep 2026) 0.97010203040Q2 '25Q4 '25Q2 '26Q4 '26Q2 '27
  • Revenue (₹ Cr), Q2 FY25 (Sep 2024): 13.83
  • Revenue (₹ Cr), Q4 FY25 (Mar 2025): 17.97
  • Revenue (₹ Cr), Q2 FY26 (Sep 2025): 13.40
  • Revenue (₹ Cr), Q4 FY26 (Mar 2026): 29.60
  • Revenue (₹ Cr), Q2 FY27 (Sep 2026): 21.38
  • Profit (₹ Cr), Q2 FY25 (Sep 2024): 0.39
  • Profit (₹ Cr), Q4 FY25 (Mar 2025): 1.10
  • Profit (₹ Cr), Q2 FY26 (Sep 2025): 1.06
  • Profit (₹ Cr), Q4 FY26 (Mar 2026): 2.02
  • Profit (₹ Cr), Q2 FY27 (Sep 2026): 0.97

Revenue (₹ Cr)

Revenue (₹ Cr)Q2 FY25 (Sep 2024) 13.83, Q4 FY25 (Mar 2025) 17.97, Q2 FY26 (Sep 2025) 13.40, Q4 FY26 (Mar 2026) 29.60, Q2 FY27 (Sep 2026) 21.38010203040Q2 '25Q4 '25Q2 '26Q4 '26Q2 '27
  • Revenue (₹ Cr), Q2 FY25 (Sep 2024): 13.83
  • Revenue (₹ Cr), Q4 FY25 (Mar 2025): 17.97
  • Revenue (₹ Cr), Q2 FY26 (Sep 2025): 13.40
  • Revenue (₹ Cr), Q4 FY26 (Mar 2026): 29.60
  • Revenue (₹ Cr), Q2 FY27 (Sep 2026): 21.38

Profit (₹ Cr)

Profit (₹ Cr)Q2 FY25 (Sep 2024) 0.39, Q4 FY25 (Mar 2025) 1.10, Q2 FY26 (Sep 2025) 1.06, Q4 FY26 (Mar 2026) 2.02, Q2 FY27 (Sep 2026) 0.9701234Q2 '25Q4 '25Q2 '26Q4 '26Q2 '27
  • Profit (₹ Cr), Q2 FY25 (Sep 2024): 0.39
  • Profit (₹ Cr), Q4 FY25 (Mar 2025): 1.10
  • Profit (₹ Cr), Q2 FY26 (Sep 2025): 1.06
  • Profit (₹ Cr), Q4 FY26 (Mar 2026): 2.02
  • Profit (₹ Cr), Q2 FY27 (Sep 2026): 0.97

Net Profit Margin (%)

Net Profit Margin (%)Q2 FY25 (Sep 2024) 2.8, Q4 FY25 (Mar 2025) 6.1, Q2 FY26 (Sep 2025) 7.9, Q4 FY26 (Mar 2026) 6.8, Q2 FY27 (Sep 2026) 4.50%5%10%15%20%Q2 '25Q4 '25Q2 '26Q4 '26Q2 '27
  • Net Profit Margin (%), Q2 FY25 (Sep 2024): 2.8
  • Net Profit Margin (%), Q4 FY25 (Mar 2025): 6.1
  • Net Profit Margin (%), Q2 FY26 (Sep 2025): 7.9
  • Net Profit Margin (%), Q4 FY26 (Mar 2026): 6.8
  • Net Profit Margin (%), Q2 FY27 (Sep 2026): 4.5
MetricCurrentQ2 FY27 (Sep 2026)PreviousQ4 FY26 (Mar 2026)
Revenue (₹ Cr)
21.38
29.60
Profit (₹ Cr)
0.97
2.02
Net Profit Margin (%)
4.5
6.8

Why profits fell behind

A sharp rise in costs outpaced sales growth. According to a scanx.trade report, purchase of stock-in-trade nearly doubled, and employee benefit expenses rose significantly. This suggests the company either faced higher input prices or incurred greater costs to fulfill orders. Total expenses grew 68% year-on-year, faster than the 60% revenue growth.

The quarter's modest ₹0.05 crore in other income was a 400% jump from a negligible base last year, but it was too small to offset the operating cost surge. Meanwhile, the company used proceeds from selling investments to repay ₹2.87 crore of short-term debt, a move noted by mCapital.in.

A more measured year ahead

External analysis points to a softer full year. An mCapital.in report projects FY27 revenue could be 3.5–5.8% lower than FY26's ₹43 crore, with net profit potentially dropping 6.5–13%. This is based on a slower first half, though the company continues to invest in capacity.

Live Chart

· VRUDDHI

(BSE)

ISIN: INE0OMZ01013

The stock market read the results as a negative. According to mCapital.in, the share price fell 5.2% on the first trading day after the announcement. The company trades at a P/E of 11.3, a significant discount to the industry average of 56.2.

Key Points

  • Revenue grew 59.6% year-on-year to ₹21.38 crore, but net profit declined 8.5% to ₹0.97 crore.
  • Net profit margin contracted sharply by 340 basis points YoY to 4.5%, as input and employee costs rose faster than sales.
  • The company reduced short-term borrowings by ₹2.87 crore, funded by the sale of investments.
  • External analysis by mCapital.in projects a potential decline in both revenue and profit for FY27 compared to the previous year.

Hexa Perspective

The quarter reveals a business grappling with the cost of growth. While demand in the construction-linked rebar coupler market appears solid, Vruddhi's profitability is being squeezed. The strategic debt reduction strengthens the balance sheet but was funded by asset sales, not operating cash.

The key question is whether this margin pressure is a temporary phase linked to specific project costs or a structural shift. With analysts anticipating a softer full year, the second half will need to show improved cost control or a richer business mix for the annual numbers to stabilize.

Share or follow HexaWealth

Also read

Want this applied to your portfolio?

Talk to a HexaWealth advisor, or sync your mutual fund data for insights tailored to your holdings.
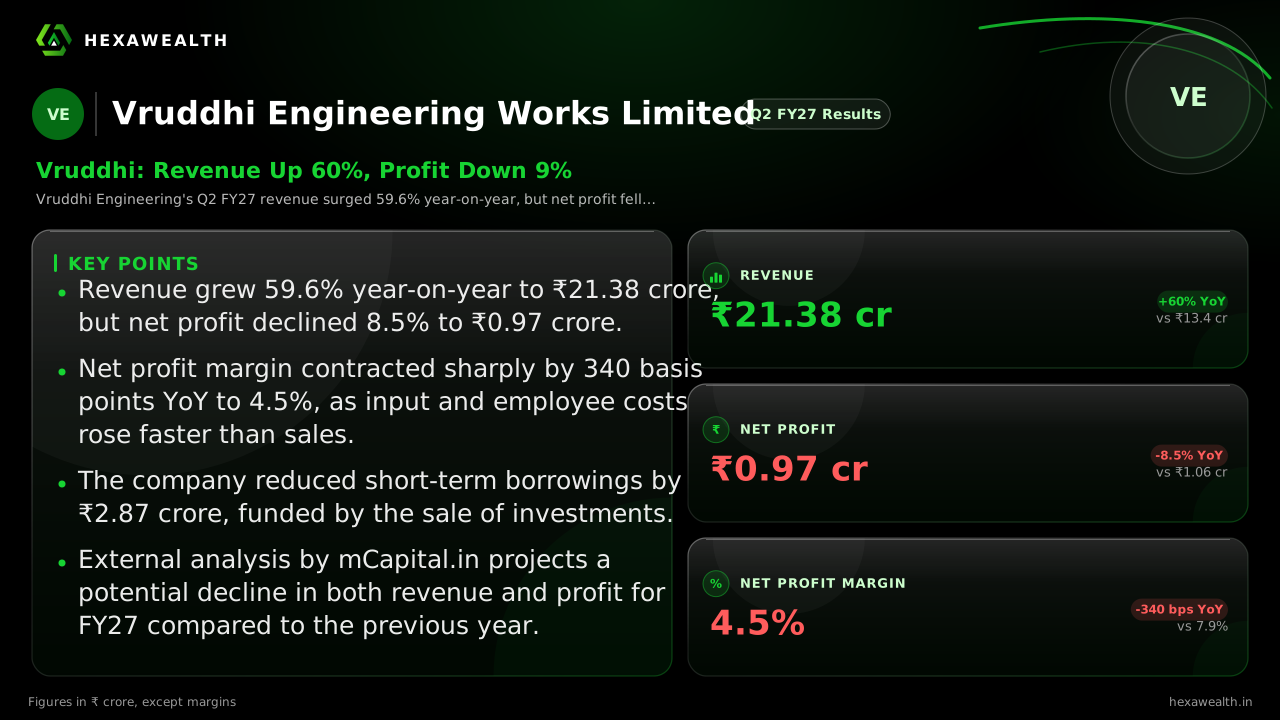
Vruddhi Engineering Works Limited (VRUDDHI) Q2 FY27 results, revenue and profits.

Frequently asked questions

What were Vruddhi Engineering's Q2 FY27 results?
For Q2 FY27 (quarter ended September 2026), Vruddhi Engineering reported revenue of ₹21.38 crore, a 59.6% increase year-on-year. Net profit was ₹0.97 crore, an 8.5% decline from the same quarter last year. The net profit margin for the quarter was 4.5%.
Why did Vruddhi Engineering's Q2 FY27 profit fall despite higher sales?
Vruddhi Engineering's Q2 FY27 profit fell 8.5% year-on-year because costs rose faster than revenue. According to a scanx.trade report, purchase of stock-in-trade and employee expenses increased sharply, compressing the net profit margin by 340 basis points to 4.5%.
What is Vruddhi Engineering's future guidance and outlook?
While no formal guidance was provided, an analysis by mCapital.in of unaudited H1 FY27 results projects a softer year. It estimates FY27 revenue could be 3.5–5.8% lower than FY26's ₹43 crore, with net profit potentially declining 6.5–13%.
What caused the sharp margin contraction for Vruddhi Engineering in Q2 FY27?
Vruddhi Engineering's net profit margin contracted 340 basis points year-on-year in Q2 FY27 due to a surge in costs. A scanx.trade report indicates purchase of stock-in-trade and employee benefit expenses rose disproportionately, outpacing the 60% revenue growth.
Was the jump in other income for Vruddhi Engineering a one-off item?
Vruddhi Engineering's other income of ₹0.05 crore in Q2 FY27 was a 400% year-on-year jump from a very low base of ₹0.01 crore. The amount is small relative to total income and was not a major factor in the quarter's performance.
How did Vruddhi Engineering's stock price react to the Q2 FY27 results?
According to mCapital.in, Vruddhi Engineering's stock price fell 5.2% on the first trading day after the Q2 FY27 results announcement on November 16, 2026. The market reacted negatively to the profit decline despite higher revenue.
What are Vruddhi Engineering's capacity expansion plans?
Vruddhi Engineering continues to invest in capacity. An mCapital.in report noted it spent ₹0.56 crore on plant and equipment in the first half of FY27, representing an 8.3% addition to its fixed asset base of ₹6.78 crore as of March 2026.
What is Vruddhi Engineering's working capital and cash flow situation?
In H1 FY27, Vruddhi Engineering generated ₹71.48 lakh in operating cash flow, as per a Wegro App report. It also sold investments to generate ₹246.07 lakh, which was primarily used to repay ₹304.46 lakh in short-term borrowings, reducing net debt.
Did Vruddhi Engineering's Q2 FY27 results beat analyst estimates?
Available research does not show specific analyst estimates for Vruddhi Engineering's Q2 FY27. However, an mCapital.in analysis framed the half-year results as a profit decline that implied a weaker full-year outlook, which the market viewed negatively.
Have institutional investors changed their stake in Vruddhi Engineering?
As of September 2026, institutional investors (FIIs/DIIs) held 0% of Vruddhi Engineering, according to data from The Economic Times. The promoter holding remained steady at 72.05%, with the public holding the remaining 27.95%.
What are the key raw material costs for Vruddhi Engineering?
As a manufacturer of rebar couplers, Vruddhi Engineering's key raw material is steel. Industry reports note that steel inputs represent a major portion of coupler material cost, and domestic steel prices saw a sharp recovery in August-September 2026 before easing in October.
What is the current order book for Vruddhi Engineering Works?
The available research and company filings for Q2 FY27 do not disclose a specific order book figure for Vruddhi Engineering Works. The revenue decline from the previous quarter suggests a lower level of project execution in the September period.
Vruddhi Engineering Works H1 FY27 results?
For H1 FY27 (half-year ended September 2026), Vruddhi Engineering reported unaudited revenue of ₹21.38 crore. Net profit was ₹0.97 crore, which represents a 9.1% decline compared to the profit in H1 FY26, according to a BSE announcement.