Shree Marutinandan (SHREE) Q4 FY26 Profit Triples Despite Lower Revenue
The steel tube distributor's Q4 FY26 net profit jumped 200% sequentially, driven by a sharper fall in expenses than in sales.
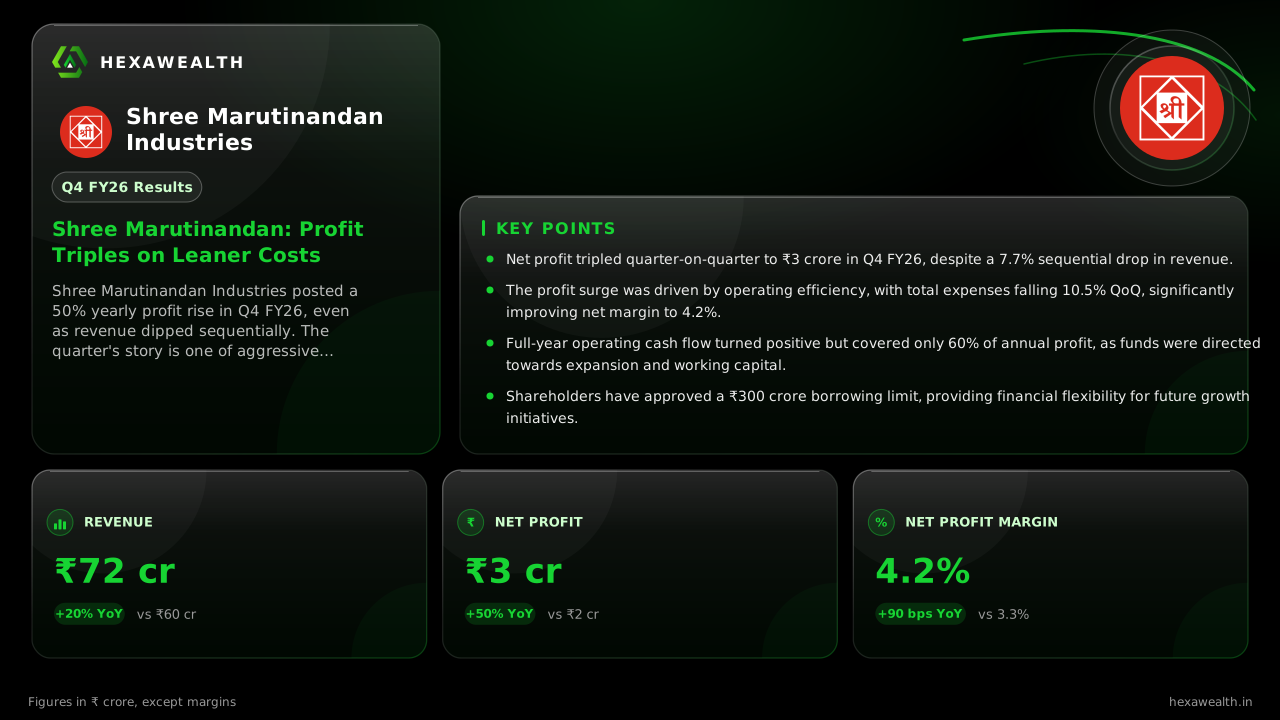
Shree Marutinandan Industries posted a 50% yearly profit rise in Q4 FY26, even as revenue dipped sequentially. The quarter's story is one of aggressive cost control, with expenses falling faster than sales to lift margins.
For a steel distributor, the quarter is a test of margin discipline when sales volumes soften. Shree Marutinandan Industries passed that test in the March quarter, turning a sequential revenue dip into a sharp profit gain through decisive cost management.
Revenue for Q4 FY26 stood at ₹72 crore, up 20% from a year earlier but down 7.7% from the September quarter. Net profit, however, tripled sequentially to ₹3 crore, pushing the net profit margin to 4.2% from 1.3% in Q2 FY26.
Revenue & profit
Revenue (₹ Cr)
Profit (₹ Cr)
- Revenue (₹ Cr), Q4 FY25: 60.0
- Revenue (₹ Cr), Q2 FY26: 78.0
- Revenue (₹ Cr), Q4 FY26: 72.0
- Profit (₹ Cr), Q4 FY25: 2.0
- Profit (₹ Cr), Q2 FY26: 1.0
- Profit (₹ Cr), Q4 FY26: 3.0
Revenue (₹ Cr)
- Revenue (₹ Cr), Q4 FY25: 60.0
- Revenue (₹ Cr), Q2 FY26: 78.0
- Revenue (₹ Cr), Q4 FY26: 72.0
Profit (₹ Cr)
- Profit (₹ Cr), Q4 FY25: 2.0
- Profit (₹ Cr), Q2 FY26: 1.0
- Profit (₹ Cr), Q4 FY26: 3.0
Net Profit Margin
- Net Profit Margin, Q4 FY25: 3.3%
- Net Profit Margin, Q2 FY26: 1.3%
- Net Profit Margin, Q4 FY26: 4.2%
| Metric | CurrentQ4 FY26 | Same quarter LYQ4 FY25 |
|---|---|---|
| Revenue (₹ Cr) | 72.0YoY +20% | 60.0 |
| Profit (₹ Cr) | 3.0YoY +50% | 2.0 |
| Net Profit Margin | 4.2%YoY +27% | 3.3% |
The cost cut that drove the quarter
The 200% sequential profit jump was powered by a 10.5% fall in total expenses, which outpaced the revenue decline. According to a report by Multibagg.ai, this was largely due to a significant reduction in inventory-related expenses compared to the year-ago period. The company's operating profit margin for the quarter, as per data from Screener.in, improved to 6% from 1.9% in Q2 FY26.
This margin improvement came without any one-time tailwind. Other income was nil in Q4 FY26, compared to ₹1 crore in the same quarter last year, making the profit growth purely operational.
A cash flow trade-off for growth
While profitability improved, cash generation remained a challenge. Operating cash flow for the full year FY26 was a positive ₹2.15 crore, a recovery from the negative ₹4.49 crore in FY25. However, it still covered only 60% of the annual profit.
Live Chart
· SHREE
(BSE)
ISIN: INE0QIS01011
The cash conversion was stretched by rising receivables and funding for expansion. Data from mCapital.in shows long-term borrowings increased in the subsequent half-year to fund fixed assets and working capital, indicating the company is leveraging its balance sheet for growth.
The outlook hinges on execution
Management's focus appears to be on a profitable mix rather than top-line growth at any cost. For the full year FY26, revenue grew 31.4% to ₹149.71 crore and profit rose 27.7% to ₹3.58 crore.
The company has also secured shareholder approval for a ₹300 crore borrowing limit, as reported by Scanx.trade, signaling preparedness for larger capital expenditure. The immediate test will be sustaining these healthier margins while managing the increased debt and working capital cycle.
Key Points
- Net profit tripled quarter-on-quarter to ₹3 crore in Q4 FY26, despite a 7.7% sequential drop in revenue.
- The profit surge was driven by operating efficiency, with total expenses falling 10.5% QoQ, significantly improving net margin to 4.2%.
- Full-year operating cash flow turned positive but covered only 60% of annual profit, as funds were directed towards expansion and working capital.
- Shareholders have approved a ₹300 crore borrowing limit, providing financial flexibility for future growth initiatives.
Hexa Perspective
The quarter demonstrates Shree Marutinandan's ability to protect profitability when sales moderate, a crucial skill in the cyclical steel distribution business. The improved margin is commendable but comes with a caveat: it was achieved alongside rising debt to fund expansion.
The path forward involves a delicate balance. The company must prove that its current investments will generate returns sufficient to service the higher leverage, all while maintaining the cost discipline that defined this quarter. The market, valuing the stock at a significant discount to the industry PE, is pricing in the execution risk of this transition.
Also read
Want this applied to your portfolio?
Talk to a HexaWealth advisor, or sync your mutual fund data for insights tailored to your holdings.