Niva Bupa (NIVABUPA) Q2 FY27 Profit Jumps 124% on Retail Surge, But Margins Face Pressure
The standalone health insurer posted a 124% YoY profit jump driven by a 47% surge in retail premiums, but sequential margin compression and a high base loom.
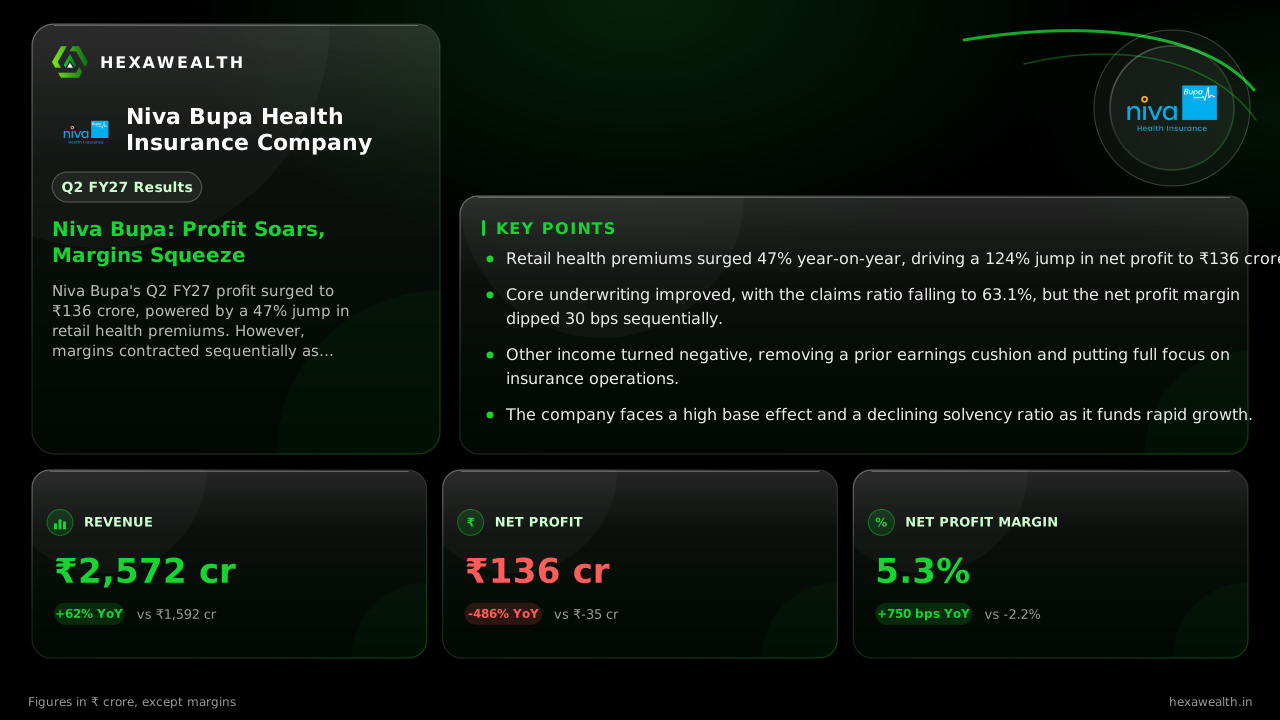
Niva Bupa's Q2 FY27 profit surged to ₹136 crore, powered by a 47% jump in retail health premiums. However, margins contracted sequentially as expenses grew, and the company faces a high base effect in the coming quarters.
For Niva Bupa, the story of the September quarter is a powerful retail engine driving profit growth, even as the road ahead gets bumpier. The standalone health insurer delivered a 124% year-on-year profit jump, a headline that masks a more nuanced picture of margin pressure and a looming high base.
The numbers show a business accelerating. Revenue grew 62% year-on-year to ₹2,572 crore. Profit after tax reached ₹136 crore, a sharp turnaround from a loss of ₹35 crore in the same quarter last year. Sequentially, however, the net profit margin slipped 30 basis points to 5.3%.
Revenue & profit
Revenue (₹ Cr)
Profit (₹ Cr)
- Revenue (₹ Cr), Q2 FY26: 1,592.0
- Revenue (₹ Cr), Q3 FY26: 1,617.6
- Revenue (₹ Cr), Q4 FY26: 2,114.5
- Revenue (₹ Cr), Q1 FY27: 2,471.8
- Revenue (₹ Cr), Q2 FY27: 2,572.0
- Profit (₹ Cr), Q2 FY26: -35.3
- Profit (₹ Cr), Q3 FY26: -87.6
- Profit (₹ Cr), Q4 FY26: 345.1
- Profit (₹ Cr), Q1 FY27: 137.8
- Profit (₹ Cr), Q2 FY27: 136.0
Revenue (₹ Cr)
- Revenue (₹ Cr), Q2 FY26: 1,592.0
- Revenue (₹ Cr), Q3 FY26: 1,617.6
- Revenue (₹ Cr), Q4 FY26: 2,114.5
- Revenue (₹ Cr), Q1 FY27: 2,471.8
- Revenue (₹ Cr), Q2 FY27: 2,572.0
Profit (₹ Cr)
- Profit (₹ Cr), Q2 FY26: -35.3
- Profit (₹ Cr), Q3 FY26: -87.6
- Profit (₹ Cr), Q4 FY26: 345.1
- Profit (₹ Cr), Q1 FY27: 137.8
- Profit (₹ Cr), Q2 FY27: 136.0
| Metric | CurrentQ2 FY27 | PreviousQ1 FY27 | Same quarter LYQ2 FY26 |
|---|---|---|---|
| Revenue (₹ Cr) | 2,572.0YoY +62% | 2,471.8 | 1,592.0 |
| Profit (₹ Cr) | 136.0YoY +485% | 137.8 | -35.3 |
| PAT Margin (%) | 5.3YoY +341% | 5.6 | -2.2 |
Retail Takes the Wheel
The profit surge was fueled almost entirely by the retail health segment. According to The Economic Times, retail health premiums soared 47% to ₹1,876 crore, while group business remained flat as management avoided unprofitable pricing. This retail focus improved the claims ratio to 63.1% from 65.1% a year ago, as reported by Kotak Neo.
Management, on the earnings call, indicated the retail book now makes up 77% of the business. The shift towards higher-quality, higher-sum-insured retail policies is a deliberate move to build a more sustainable and profitable franchise.
The Cost of Growth
Despite the top-line momentum, profitability faced headwinds. Total expenses grew 47% year-on-year, slightly outpacing revenue growth. The expense ratio, while improving annually, remains a key watchpoint. Furthermore, other income fell over 100% both year-on-year and sequentially, turning negative this quarter.
Live Chart
· NIVABUPA
(BSE)
ISIN: INE995S01015
This sharp decline, from ₹198 crore in Q1 to -₹2 crore in Q2, stripped away a significant earnings buffer. It highlights that the core insurance performance, while strong, is now carrying the full weight of profitability without investment income support.
Navigating a Higher Base
The immediate challenge is a tough comparison period. Nomura noted in its report that the broader retail health insurance industry, including Niva Bupa, now faces a high base from October 2026. Management has guided for continued 30% year-on-year retail growth despite this, a test of its execution and pricing discipline.
The solvency ratio, a measure of capital adequacy, declined to 2.03x from 2.85x a year ago, as rapid business growth consumes capital. The company has board approval to raise up to ₹500 crore in debt to support its plans, as mentioned in its H1 presentation.
Key Points
- Retail health premiums surged 47% year-on-year, driving a 124% jump in net profit to ₹136 crore.
- Core underwriting improved, with the claims ratio falling to 63.1%, but the net profit margin dipped 30 bps sequentially.
- Other income turned negative, removing a prior earnings cushion and putting full focus on insurance operations.
- The company faces a high base effect and a declining solvency ratio as it funds rapid growth.
Hexa Perspective
Niva Bupa’s quarter confirms its successful pivot to retail, a segment with better pricing power and growth visibility in India’s underpenetrated market. The improvement in claims ratio is a positive signal of underwriting discipline.
The squeeze comes from two sides: the loss of other income and the capital intensity of growth. Sustaining 30% retail expansion against a high base while managing the expense ratio and solvency will determine if this profit trajectory is durable. The market’s 6.6% stock jump on results day, noted by Kotak Neo, reflects approval of the growth story, but the margin compression is a note of caution for the quarters ahead.
Also read
Want this applied to your portfolio?
Talk to a HexaWealth advisor, or sync your mutual fund data for insights tailored to your holdings.