Lee & Nee (LEENEE) Q2 FY27 Profit Stalls as Costs Outrun 58% Revenue Surge
The IT services firm posted its highest-ever quarterly revenue, but a sequential profit dip highlights a core business that remains loss-making.
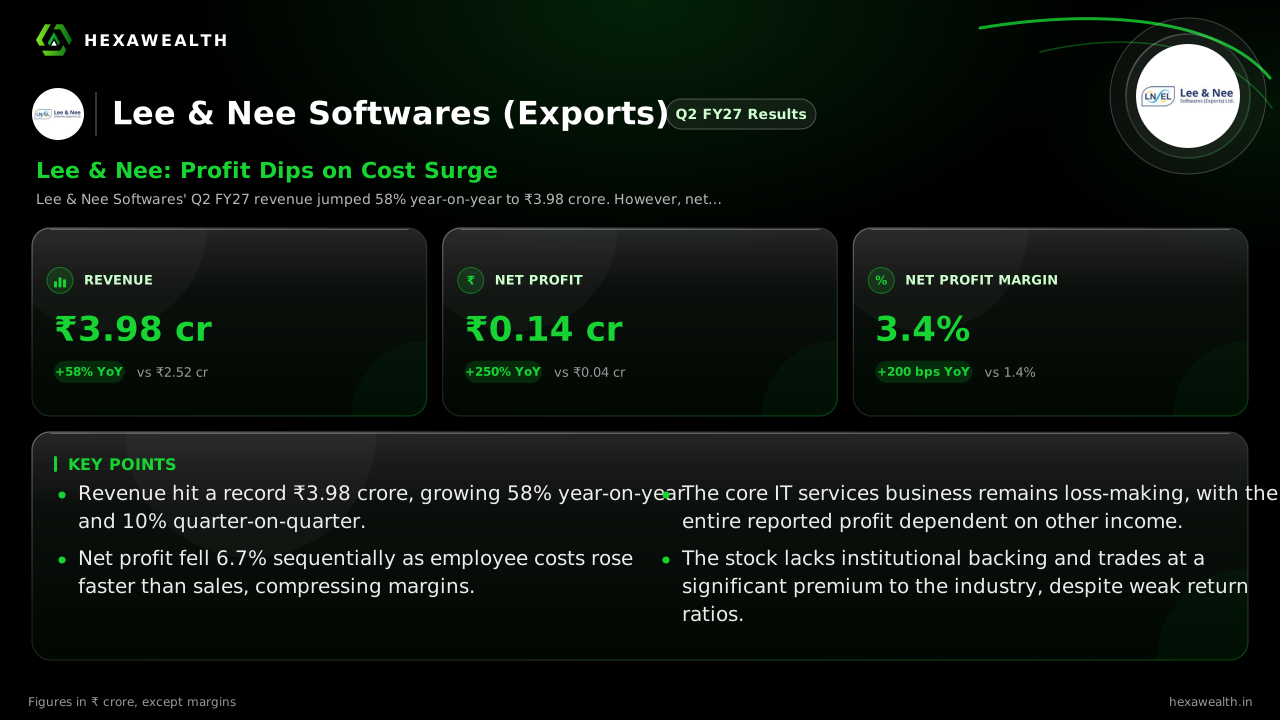
Lee & Nee Softwares' Q2 FY27 revenue jumped 58% year-on-year to ₹3.98 crore. However, net profit fell 6.7% sequentially as employee costs surged, keeping the core IT business unprofitable.
For a micro-cap IT services firm, the challenge is turning revenue growth into sustainable profit. Lee & Nee Softwares' September quarter delivered a record top line but left that fundamental question unanswered.
Revenue reached ₹3.98 crore, up 58% from a year ago and 10% from the June quarter. Net profit, however, slipped to ₹0.14 crore, down 6.7% sequentially despite the sales increase. The net profit margin compressed 70 basis points quarter-on-quarter to 3.4%.
Revenue & profit
Revenue (₹ Cr)
Profit (₹ Cr)
- Revenue (₹ Cr), Q2 FY26: 2.52
- Revenue (₹ Cr), Q3 FY26: 2.78
- Revenue (₹ Cr), Q4 FY26: 3.74
- Revenue (₹ Cr), Q1 FY27: 3.61
- Revenue (₹ Cr), Q2 FY27: 3.98
- Profit (₹ Cr), Q2 FY26: 0.04
- Profit (₹ Cr), Q3 FY26: 0.11
- Profit (₹ Cr), Q4 FY26: 0.09
- Profit (₹ Cr), Q1 FY27: 0.15
- Profit (₹ Cr), Q2 FY27: 0.14
Revenue (₹ Cr)
- Revenue (₹ Cr), Q2 FY26: 2.52
- Revenue (₹ Cr), Q3 FY26: 2.78
- Revenue (₹ Cr), Q4 FY26: 3.74
- Revenue (₹ Cr), Q1 FY27: 3.61
- Revenue (₹ Cr), Q2 FY27: 3.98
Profit (₹ Cr)
- Profit (₹ Cr), Q2 FY26: 0.04
- Profit (₹ Cr), Q3 FY26: 0.11
- Profit (₹ Cr), Q4 FY26: 0.09
- Profit (₹ Cr), Q1 FY27: 0.15
- Profit (₹ Cr), Q2 FY27: 0.14
Net Profit Margin (%)
- Net Profit Margin (%), Q2 FY26: 1.4
- Net Profit Margin (%), Q3 FY26: 4.0
- Net Profit Margin (%), Q4 FY26: 2.3
- Net Profit Margin (%), Q1 FY27: 4.1
- Net Profit Margin (%), Q2 FY27: 3.4
| Metric | CurrentQ2 FY27 | PreviousQ1 FY27 | Same quarter LYQ2 FY26 |
|---|---|---|---|
| Revenue (₹ Cr) | 3.98YoY +58% | 3.61 | 2.52 |
| Profit (₹ Cr) | 0.14YoY +250% | 0.15 | 0.04 |
| Net Profit Margin (%) | 3.4YoY +143% | 4.1 | 1.4 |
The Core Business Still Burns Cash
The headline profit masks a persistent operational deficit. According to a MarketsMojo analysis, the company's operating profit excluding other income was negative ₹0.13 crore. This means the core IT services business lost money.
Employee costs, which consumed 41% of revenue, rose 7.4% sequentially to ₹1.63 crore. In a labour-intensive business lacking pricing power, this cost surge directly ate into profitability. Total expenses grew 12% quarter-on-quarter, faster than the 10% revenue growth.
Leaning on Non-Operating Income
The entire reported profit, and more, came from other sources. Other income of ₹0.34 crore was more than double the net profit for the quarter. MarketsMojo notes this structural reliance on investment income or other non-operating sources has persisted for at least seven consecutive quarters.
Live Chart
· LEENEE
(BSE)
ISIN: INE791B01014
This dependency raises questions about earnings quality and business model viability. Without this lifeline, the company would post a loss at the EBITDA level.
Market Reaction and the Scale Question
The stock rose 1.7% the day after results, according to TipRanks data, but is down 29% over the past year. The company carries zero institutional ownership, signaling a lack of professional investor confidence.
The path forward hinges on achieving scale. Analysts suggest quarterly revenue sustainably crossing ₹5-6 crore could enable better cost absorption. For now, the company operates in a tough mid-tier IT environment where Crisil Ratings notes AI is intensifying pricing pressure.
Key Points
- Revenue hit a record ₹3.98 crore, growing 58% year-on-year and 10% quarter-on-quarter.
- Net profit fell 6.7% sequentially as employee costs rose faster than sales, compressing margins.
- The core IT services business remains loss-making, with the entire reported profit dependent on other income.
- The stock lacks institutional backing and trades at a significant premium to the industry, despite weak return ratios.
Hexa Perspective
The quarter reveals a company caught between impressive top-line momentum and a broken operating model. The 58% revenue growth is undeniable, but it's not translating to operating profit.
The reliance on other income is unsustainable as a long-term strategy. Investors are essentially betting on the company's ability to reach a revenue scale where operating leverage finally kicks in, a threshold it has not yet approached in nearly four decades of operation. Until that happens, the reported profits are a mirage over a cash-burning core.
Also read
Want this applied to your portfolio?
Talk to a HexaWealth advisor, or sync your mutual fund data for insights tailored to your holdings.