Interiors & More (INM) Q2 FY27 Profit Growth Slows as New Factory Costs Bite
Revenue jumped 59% year-on-year, but profit growth lagged as interest and depreciation from a new plant weighed on margins.
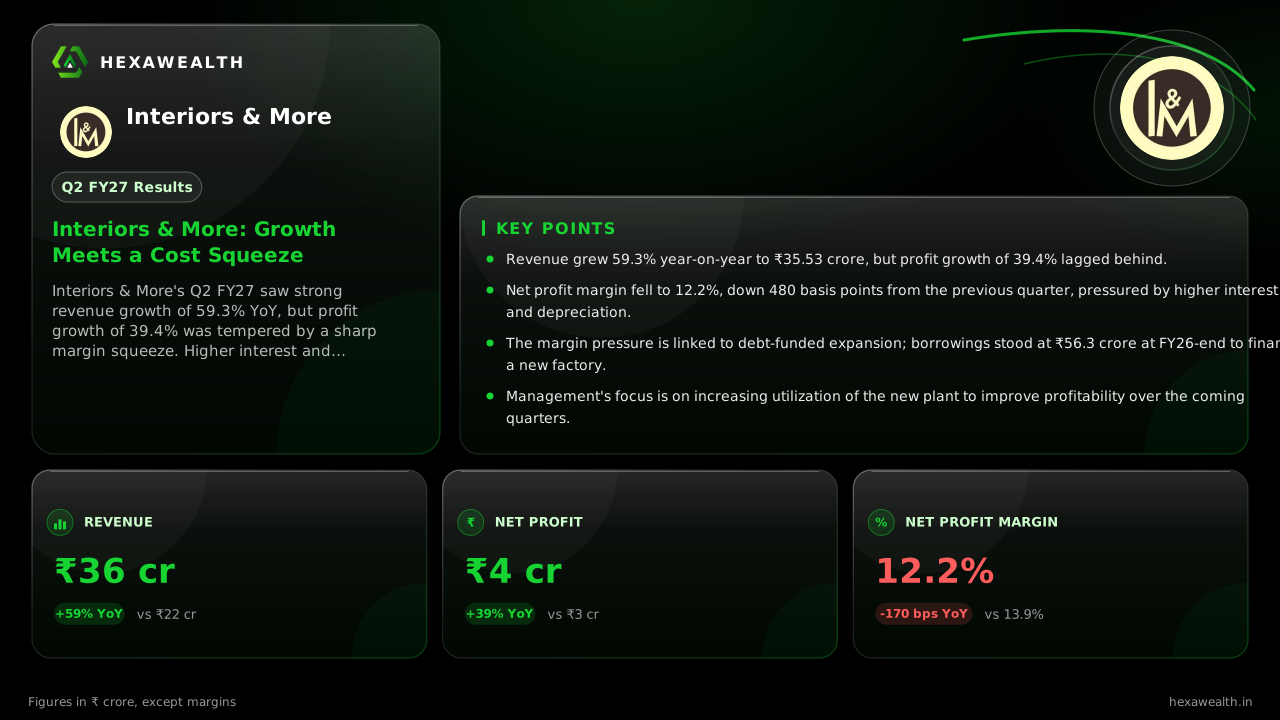
Interiors & More's Q2 FY27 saw strong revenue growth of 59.3% YoY, but profit growth of 39.4% was tempered by a sharp margin squeeze. Higher interest and depreciation costs from a new factory expansion are pressuring profitability.
For a company investing heavily to bring production in-house, the test is whether sales can grow fast enough to cover the new costs. Interiors & More's September quarter shows that tension clearly. While revenue surged 59% from a year ago, profitability weakened as the bills for its new factory came due.
The numbers tell a story of top-line strength but bottom-line strain. Revenue reached ₹35.53 crore, a solid jump from last year's ₹22.31 crore. Profit grew to ₹4.32 crore from ₹3.10 crore. Yet the net profit margin contracted 170 basis points year-on-year to 12.2%, and fell sharply from 17.0% in the previous March quarter.
Revenue & profit
Revenue (₹ Cr)
Profit (₹ Cr)
- Revenue (₹ Cr), Q2 FY25 (Sep 2024): 18.00
- Revenue (₹ Cr), Q4 FY25 (Mar 2025): 40.95
- Revenue (₹ Cr), Q2 FY26 (Sep 2025): 22.31
- Revenue (₹ Cr), Q4 FY26 (Mar 2026): 61.29
- Revenue (₹ Cr), Q2 FY27 (Sep 2026): 35.53
- Profit (₹ Cr), Q2 FY25 (Sep 2024): 4.00
- Profit (₹ Cr), Q4 FY25 (Mar 2025): 7.81
- Profit (₹ Cr), Q2 FY26 (Sep 2025): 3.10
- Profit (₹ Cr), Q4 FY26 (Mar 2026): 10.44
- Profit (₹ Cr), Q2 FY27 (Sep 2026): 4.32
Revenue (₹ Cr)
- Revenue (₹ Cr), Q2 FY25 (Sep 2024): 18.00
- Revenue (₹ Cr), Q4 FY25 (Mar 2025): 40.95
- Revenue (₹ Cr), Q2 FY26 (Sep 2025): 22.31
- Revenue (₹ Cr), Q4 FY26 (Mar 2026): 61.29
- Revenue (₹ Cr), Q2 FY27 (Sep 2026): 35.53
Profit (₹ Cr)
- Profit (₹ Cr), Q2 FY25 (Sep 2024): 4.00
- Profit (₹ Cr), Q4 FY25 (Mar 2025): 7.81
- Profit (₹ Cr), Q2 FY26 (Sep 2025): 3.10
- Profit (₹ Cr), Q4 FY26 (Mar 2026): 10.44
- Profit (₹ Cr), Q2 FY27 (Sep 2026): 4.32
Net Profit Margin (%)
- Net Profit Margin (%), Q2 FY25 (Sep 2024): 22.2
- Net Profit Margin (%), Q4 FY25 (Mar 2025): 19.1
- Net Profit Margin (%), Q2 FY26 (Sep 2025): 13.9
- Net Profit Margin (%), Q4 FY26 (Mar 2026): 17.0
- Net Profit Margin (%), Q2 FY27 (Sep 2026): 12.2
| Metric | CurrentQ2 FY27 (Sep 2026) | PreviousQ4 FY26 (Mar 2026) |
|---|---|---|
| Revenue (₹ Cr) | 35.53 | 61.29 |
| Profit (₹ Cr) | 4.32 | 10.44 |
| Net Profit Margin (%) | 12.2 | 17.0 |
Why margins are under pressure
The margin squeeze stems directly from the company's capacity build-up. According to Newboard, borrowings rose to ₹56.3 crore at the end of FY26, largely to fund a new 200,000 sq ft factory in Umbergaon, Gujarat. This investment is now hitting the income statement. Interest expense soared 148% year-on-year and 80% sequentially. Depreciation rose 66% from last year.
These fixed costs arrived before the new plant reached full utilization. The CFO has said it runs at about half its capability, notes Newboard. This mismatch between costs and volume is the core challenge for the next few quarters.
The path ahead depends on utilization
Management's priority for FY27 is filling this factory, according to the annual report. The aim is to raise in-house manufacturing from about half to nearly 90% of the product range over five years. Success hinges on converting this capacity into sales without further eroding margins.
Live Chart
· INM
(BSE)
ISIN: INE0OPC01015
The stock closed at ₹138 on November 9, up 4.55% on the day of the results. It remains 48% lower over the past year. Research from Simply Wall St flags a key risk: debt is not well covered by operating cash flow. With no active sell-side coverage, the market is weighing execution risk against the long-term import-substitution story.
Key Points
- Revenue grew 59.3% year-on-year to ₹35.53 crore, but profit growth of 39.4% lagged behind.
- Net profit margin fell to 12.2%, down 480 basis points from the previous quarter, pressured by higher interest and depreciation.
- The margin pressure is linked to debt-funded expansion; borrowings stood at ₹56.3 crore at FY26-end to finance a new factory.
- Management's focus is on increasing utilization of the new plant to improve profitability over the coming quarters.
Hexa Perspective
This quarter underscores the classic growth-investment trade-off. The revenue jump confirms demand for its artificial flowers and decor, but the new factory's costs are diluting earnings faster than sales can offset them. The next few quarters will be decisive. If sales momentum continues and the plant utilization rises as planned, operating leverage should eventually kick in. The risk is that high interest costs persist if sales growth slows or the capacity ramp-up is delayed. Investors are effectively funding a transition to greater self-reliance, betting that the future margin improvement will justify today's squeeze.
Also read
Want this applied to your portfolio?
Talk to a HexaWealth advisor, or sync your mutual fund data for insights tailored to your holdings.