All posts

Follow Us

LinkedInInstagramX
Quarterly ResultsArchiveLast updated 12 November 20263 min read

Decorous Investment (DITCO) Q2 FY27's Revenue Surge Fails to Deliver Profit

The company's Q2 revenue soared 333% year-on-year, but profit fell 50% as expenses ballooned and other income collapsed.

By Anant Kacholia, HexaWealth Research · Created 11 November 2026

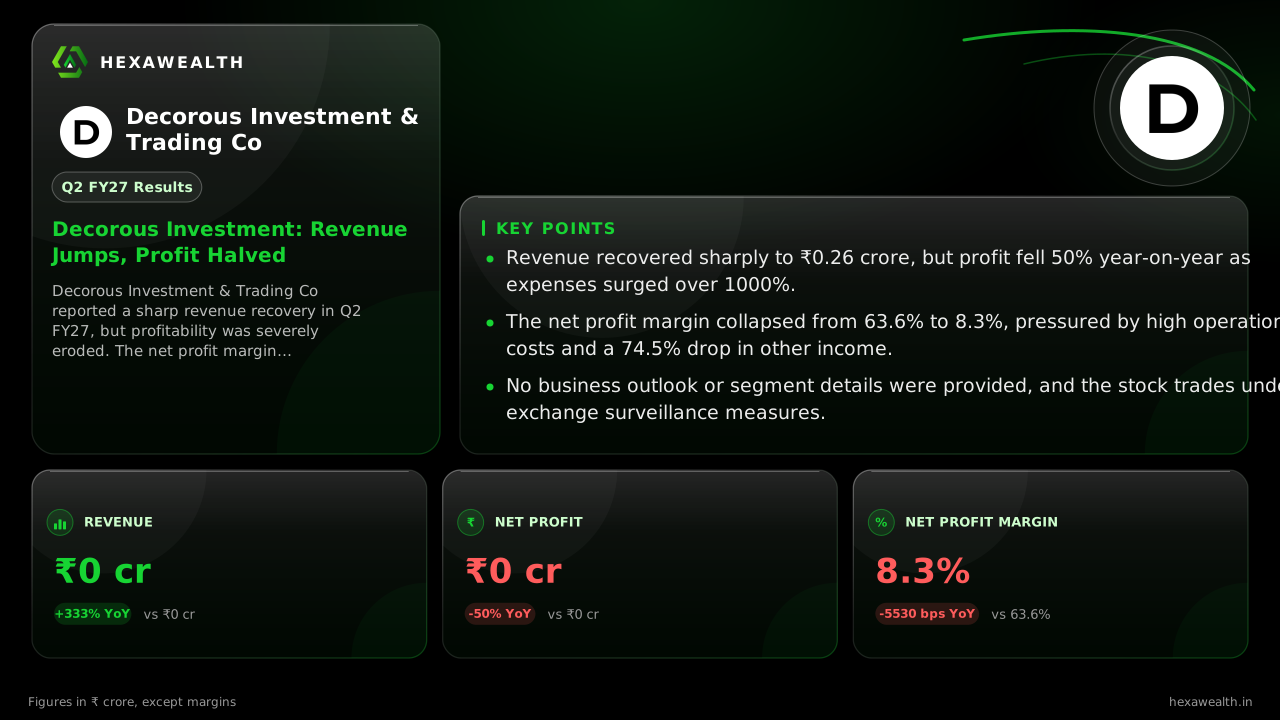
Decorous Investment & Trading Co reported a sharp revenue recovery in Q2 FY27, but profitability was severely eroded. The net profit margin collapsed from 63.6% to 8.3% as total expenses surged over 1000%.

For a micro-cap company with a history of sporadic deal flow, a single quarter can define a year. Decorous Investment & Trading's September quarter delivered exactly that, with revenue rebounding sharply from a near-zero base. Yet the headline growth masked a severe profitability squeeze, as the business model's inherent volatility was laid bare.

The numbers tell a story of two diverging lines. Revenue jumped to ₹0.26 crore, up 333% from a year ago and a massive 2500% from the preceding quarter. Profit, however, moved in the opposite direction, falling 50% year-on-year to ₹0.02 crore.

Revenue & profit

Revenue (₹ Cr)

Profit (₹ Cr)

Revenue & profitQ2 FY26 (Sep 2025) 0.06, Q3 FY26 (Dec 2025) 0.23, Q4 FY26 (Mar 2026) 0.12, Q1 FY27 (Jun 2026) 0.01, Q2 FY27 (Sep 2026) 0.26. Q2 FY26 (Sep 2025) 0.04, Q3 FY26 (Dec 2025) 0.06, Q4 FY26 (Mar 2026) -0.03, Q1 FY27 (Jun 2026) -0.02, Q2 FY27 (Sep 2026) 0.02-2-1012Q2 '26Q3 '26Q4 '26Q1 '27Q2 '27
  • Revenue (₹ Cr), Q2 FY26 (Sep 2025): 0.06
  • Revenue (₹ Cr), Q3 FY26 (Dec 2025): 0.23
  • Revenue (₹ Cr), Q4 FY26 (Mar 2026): 0.12
  • Revenue (₹ Cr), Q1 FY27 (Jun 2026): 0.01
  • Revenue (₹ Cr), Q2 FY27 (Sep 2026): 0.26
  • Profit (₹ Cr), Q2 FY26 (Sep 2025): 0.04
  • Profit (₹ Cr), Q3 FY26 (Dec 2025): 0.06
  • Profit (₹ Cr), Q4 FY26 (Mar 2026): -0.03
  • Profit (₹ Cr), Q1 FY27 (Jun 2026): -0.02
  • Profit (₹ Cr), Q2 FY27 (Sep 2026): 0.02

Revenue (₹ Cr)

Revenue (₹ Cr)Q2 FY26 (Sep 2025) 0.06, Q3 FY26 (Dec 2025) 0.23, Q4 FY26 (Mar 2026) 0.12, Q1 FY27 (Jun 2026) 0.01, Q2 FY27 (Sep 2026) 0.2600.511.52Q2 '26Q3 '26Q4 '26Q1 '27Q2 '27
  • Revenue (₹ Cr), Q2 FY26 (Sep 2025): 0.06
  • Revenue (₹ Cr), Q3 FY26 (Dec 2025): 0.23
  • Revenue (₹ Cr), Q4 FY26 (Mar 2026): 0.12
  • Revenue (₹ Cr), Q1 FY27 (Jun 2026): 0.01
  • Revenue (₹ Cr), Q2 FY27 (Sep 2026): 0.26

Profit (₹ Cr)

Profit (₹ Cr)Q2 FY26 (Sep 2025) 0.04, Q3 FY26 (Dec 2025) 0.06, Q4 FY26 (Mar 2026) -0.03, Q1 FY27 (Jun 2026) -0.02, Q2 FY27 (Sep 2026) 0.02-2-1012Q2 '26Q3 '26Q4 '26Q1 '27Q2 '27
  • Profit (₹ Cr), Q2 FY26 (Sep 2025): 0.04
  • Profit (₹ Cr), Q3 FY26 (Dec 2025): 0.06
  • Profit (₹ Cr), Q4 FY26 (Mar 2026): -0.03
  • Profit (₹ Cr), Q1 FY27 (Jun 2026): -0.02
  • Profit (₹ Cr), Q2 FY27 (Sep 2026): 0.02

Net Profit Margin (%)

Net Profit Margin (%)Q2 FY26 (Sep 2025) 63.6, Q3 FY26 (Dec 2025) 25.7, Q4 FY26 (Mar 2026) -26.4, Q1 FY27 (Jun 2026) -, Q2 FY27 (Sep 2026) 8.3-80%-40%0%40%80%Q2 '26Q3 '26Q4 '26Q1 '27Q2 '27
  • Net Profit Margin (%), Q2 FY26 (Sep 2025): 63.6
  • Net Profit Margin (%), Q3 FY26 (Dec 2025): 25.7
  • Net Profit Margin (%), Q4 FY26 (Mar 2026): -26.4
  • Net Profit Margin (%), Q1 FY27 (Jun 2026): -
  • Net Profit Margin (%), Q2 FY27 (Sep 2026): 8.3
MetricCurrentQ2 FY27 (Sep 2026)PreviousQ1 FY27 (Jun 2026)
Revenue (₹ Cr)
0.26
0.01
Profit (₹ Cr)
0.02
-0.02
Net Profit Margin (%)
8.3
-

The cost of doing business

The collapse in the net profit margin, from 63.6% to 8.3%, is the quarter's central puzzle. It was driven by a staggering 1180% year-on-year surge in total expenses to ₹0.26 crore, which fully consumed the quarter's revenue. While employee costs rose a modest 40%, the bulk of the expense jump appears linked to the cost of sales for the revenue-generating activity itself.

Compounding the pressure, other income—a key profit contributor in the past—plummeted 74.5% to just ₹0.01 crore. This sharp decline removed a cushion that had previously supported margins, making the business far more dependent on its core, and now costly, operations.

A market left guessing

Management provided no specific commentary or forward guidance with the results filing. An analysis by mcapital.in noted the board approval contained no extracted financial figures, offering “no visible change to the business outlook.” The stock reflected this uncertainty, falling 3.1% the day after the announcement.

Live Chart

· DITCO

(BSE)

ISIN: INE183R01010

The company also remains under regulatory watch, with its stock placed in the Additional and Graded Surveillance Measures framework. This adds a layer of caution for investors navigating its volatile financials.

Key Points

  • Revenue recovered sharply to ₹0.26 crore, but profit fell 50% year-on-year as expenses surged over 1000%.
  • The net profit margin collapsed from 63.6% to 8.3%, pressured by high operational costs and a 74.5% drop in other income.
  • No business outlook or segment details were provided, and the stock trades under exchange surveillance measures.

Hexa Perspective

This quarter underscores the challenge of a project-based business where revenue is lumpy and profitability is not guaranteed. The revenue rebound is a positive step away from the preceding quarter's drought, but the severe margin compression raises questions about the sustainability and quality of earnings.

Investors are left weighing a return to top-line activity against a model that consumes most of its revenue in costs. Until the company demonstrates it can consistently convert sales into profit, or until other income returns as a stabilizer, the earnings trajectory will remain highly unpredictable.

Share or follow HexaWealth

Also read

Want this applied to your portfolio?

Talk to a HexaWealth advisor, or sync your mutual fund data for insights tailored to your holdings.
Decorous Investment & Trading Co (DITCO) Q2 FY27 results, revenue and profits.

Frequently asked questions

What were Decorous Investment & Trading Co's Q2 FY27 results?
For Q2 FY27 (September 2026), Decorous Investment reported revenue of ₹0.26 crore, a 333% year-on-year increase. However, net profit fell 50% to ₹0.02 crore. The net profit margin collapsed to 8.3% from 63.6% a year ago due to a massive surge in total expenses.
Why did Decorous Investment's profit fall 50% despite huge revenue growth in Q2 FY27?
Profit fell because total expenses surged 1180% year-on-year to ₹0.26 crore, fully offsetting the revenue gain. Furthermore, other income, which previously boosted profits, dropped 74.5%. This combination of higher operational costs and lower other income severely compressed profitability.
What caused Decorous Investment's net profit margin to collapse in Q2 FY27?
The net profit margin collapsed from 63.6% to 8.3% primarily due to a 1180% year-on-year surge in total expenses. A sharp 74.5% decline in other income, which had provided a significant margin cushion in the year-ago quarter, further exacerbated the profitability squeeze.
Was Decorous Investment's Q2 revenue driven by real estate or gems & jewelry?
The company's regulatory filing did not break down revenue by segment. Decorous Investment operates in both real estate consultancy and the gems & jewelry trade, but the specific driver for the Q2 FY27 revenue surge was not disclosed in the available announcements.
What is the nature of the expenses that surged over 1000% YoY for Decorous Investment?
While the filing does not provide a detailed breakdown, the 1180% surge in total expenses to ₹0.26 crore appears directly linked to the cost of sales for the revenue-generating activity. Employee costs rose only 40%, indicating the bulk of the increase was operational and not related to staff.
What guidance did Decorous Investment management provide for future quarters?
The company provided no specific business outlook or forward guidance with its Q2 FY27 results. An analysis by mcapital.in noted the board approval contained no extracted financial figures, offering no visible change to the business outlook for shareholders.
Did Decorous Investment undertake any significant one-time transaction in Q2?
There is no indication of a significant one-time transaction, asset sale, or investment deal in Q2 FY27. Regulatory filings from the period show routine compliance certificates with, as noted by alfafinder.com, "no transactional or financial substance."
What were analyst estimates for Decorous Investment's Q2 FY27 results?
Decorous Investment, as a micro-cap stock, has no active sell-side analyst coverage or published consensus estimates for its quarterly results. Therefore, there are no formal analyst estimates to beat or miss for the Q2 FY27 period.
Have any brokerages changed their rating after Decorous Investment's Q2 results?
No. Decorous Investment & Trading Co has no active sell-side analyst coverage, as confirmed by data from sharpely.in. Consequently, no brokerage firms have issued or changed ratings or target prices following the Q2 FY27 results.
How did Decorous Investment's stock price react to the Q2 FY27 results?
The stock fell 3.1% on November 11, 2026, the trading day after the Q2 results were announced. Data from mcapital.in classified the board meeting outcome as having a "low impact" and a "neutral" effect on shareholders.
What is the demand environment for India's gems and jewelry trade?
The broader industry saw strong festive demand, with reports from The Economic Times noting a Dhanteras sales surge. However, high gold prices are pressuring volumes, with Crisil Ratings projecting a 4-6% volume decline for organized retailers in FY27 despite higher value sales.
Are there regulatory issues facing Decorous Investment & Trading Co?
Yes. The company's stock is placed in the Additional Surveillance Measure (ASM) and Graded Surveillance Measure (GSM) lists. Furthermore, a filing noted by alfafinder.com mentions pending fine waiver applications for past SEBI LODR non-compliances totaling ₹0.43 crore.
What caused the low revenue and net loss in Q1 FY27?
In Q1 FY27 (June 2026), Decorous Investment reported revenue of just ₹0.01 crore and a net loss of ₹0.02 crore. Business Standard reported there were "no Sales" in the quarter, indicating a complete lack of deal flow or trading activity during that period.
Why was other income high relative to revenue in Q2 FY26?
In Q2 FY26, other income was ₹0.06 crore, matching the revenue of ₹0.06 crore. This high other income, likely from investments or one-time gains, was the primary reason the net profit margin reached an unusually high 63.6% that quarter.
Decorous Investment & Trading Co Q2 FY27 results August 2026
Decorous Investment announced its Q2 FY27 results for the period ended September 2026 on November 10, 2026. Revenue was ₹0.26 crore, up 333% year-on-year, but net profit fell 50% to ₹0.02 crore due to a massive surge in operational expenses.