All posts

Follow Us

LinkedInInstagramX
Quarterly ResultsArchiveLast updated 22 November 20263 min read

Chatterbox (CHTR) Q2 FY27 Revenue Jumps 47% as Profit Growth Lags

Chatterbox Technologies posted a 47% YoY revenue surge in Q2 FY27, but profit growth of 20% lagged as heavy investment and IPO costs squeezed margins.

By Anant Kacholia, HexaWealth Research · Created 13 November 2026

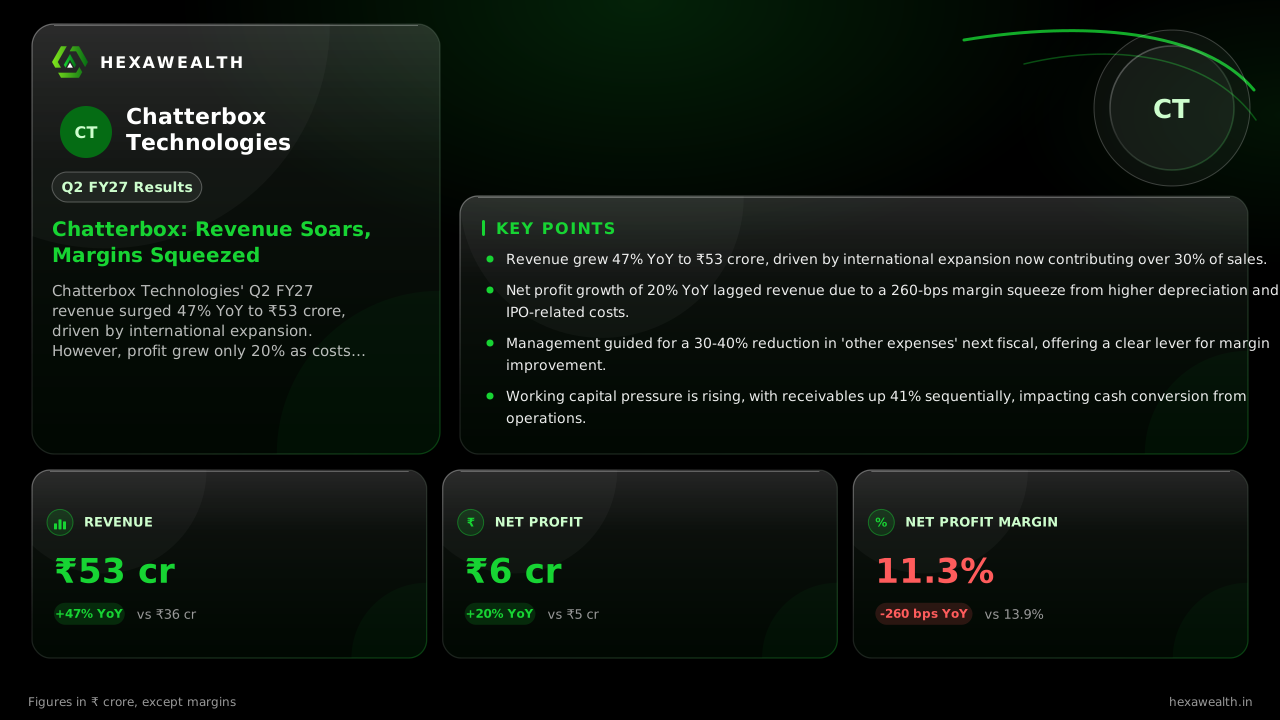
Chatterbox Technologies' Q2 FY27 revenue surged 47% YoY to ₹53 crore, driven by international expansion. However, profit grew only 20% as costs from investments and IPO activities compressed net margins to 11.3%.

For Chatterbox Technologies, the story of Q2 FY27 is one of explosive top-line growth meeting the heavy costs of building a global platform. Revenue surged 47% year-on-year, yet profit grew at half that pace, revealing the margin pressure from strategic investments made since its IPO.

The numbers show a clear split. Revenue hit ₹53 crore, up 10% from the previous quarter. Profit reached ₹6 crore, a stronger 36% sequential jump. The net profit margin, however, sits at 11.3%, down 260 basis points from last year.

Revenue & profit

Revenue (₹ Cr)

Profit (₹ Cr)

Revenue & profitQ2 FY25 27.0, Q4 FY25 32.0, Q2 FY26 36.0, Q4 FY26 48.24, Q2 FY27 53.0. Q2 FY25 4.0, Q4 FY25 5.0, Q2 FY26 5.0, Q4 FY26 4.4, Q2 FY27 6.0020406080Q2 '25Q4 '25Q2 '26Q4 '26Q2 '27
  • Revenue (₹ Cr), Q2 FY25: 27.0
  • Revenue (₹ Cr), Q4 FY25: 32.0
  • Revenue (₹ Cr), Q2 FY26: 36.0
  • Revenue (₹ Cr), Q4 FY26: 48.24
  • Revenue (₹ Cr), Q2 FY27: 53.0
  • Profit (₹ Cr), Q2 FY25: 4.0
  • Profit (₹ Cr), Q4 FY25: 5.0
  • Profit (₹ Cr), Q2 FY26: 5.0
  • Profit (₹ Cr), Q4 FY26: 4.4
  • Profit (₹ Cr), Q2 FY27: 6.0

Revenue (₹ Cr)

Revenue (₹ Cr)Q2 FY25 27.0, Q4 FY25 32.0, Q2 FY26 36.0, Q4 FY26 48.24, Q2 FY27 53.0020406080Q2 '25Q4 '25Q2 '26Q4 '26Q2 '27
  • Revenue (₹ Cr), Q2 FY25: 27.0
  • Revenue (₹ Cr), Q4 FY25: 32.0
  • Revenue (₹ Cr), Q2 FY26: 36.0
  • Revenue (₹ Cr), Q4 FY26: 48.24
  • Revenue (₹ Cr), Q2 FY27: 53.0

Profit (₹ Cr)

Profit (₹ Cr)Q2 FY25 4.0, Q4 FY25 5.0, Q2 FY26 5.0, Q4 FY26 4.4, Q2 FY27 6.002468Q2 '25Q4 '25Q2 '26Q4 '26Q2 '27
  • Profit (₹ Cr), Q2 FY25: 4.0
  • Profit (₹ Cr), Q4 FY25: 5.0
  • Profit (₹ Cr), Q2 FY26: 5.0
  • Profit (₹ Cr), Q4 FY26: 4.4
  • Profit (₹ Cr), Q2 FY27: 6.0

Net Profit Margin (%)

Net Profit Margin (%)Q2 FY25 14.8, Q4 FY25 15.6, Q2 FY26 13.9, Q4 FY26 9.1, Q2 FY27 11.30%5%10%15%20%Q2 '25Q4 '25Q2 '26Q4 '26Q2 '27
  • Net Profit Margin (%), Q2 FY25: 14.8
  • Net Profit Margin (%), Q4 FY25: 15.6
  • Net Profit Margin (%), Q2 FY26: 13.9
  • Net Profit Margin (%), Q4 FY26: 9.1
  • Net Profit Margin (%), Q2 FY27: 11.3
MetricCurrentQ2 FY27Same quarter LYQ2 FY26
Revenue (₹ Cr)
53.0YoY +47%
36.0
Profit (₹ Cr)
6.0YoY +20%
5.0
Net Profit Margin (%)
11.3YoY -19%
13.9

The Growth Engine: Going Global

The revenue surge was powered by a deliberate international push. Management stated on the concall that overseas markets now contribute over 30% of revenue, up from 18% in FY26. The newly operational Dubai hub acts as a gateway, though its ramp-up was delayed by external geopolitical events, according to a report from Perivis.

Why Profits Didn't Keep Pace

While revenue climbed, total expenses grew faster at 54% YoY. This squeeze came from two fronts: investment and one-off costs. Depreciation doubled year-on-year, reflecting capital expenditure on studios and tech. Other expenses ballooned, which the CFO attributed to IPO-related PR, legal fees, and new office rent.

The company expects these 'other expenses' to fall 30-40% next financial year as the IPO costs normalize, a specific guidance noted in the Sovrenn concall summary. This is the clearest path to margin recovery.

Live Chart

· CHTR

(BSE)

ISIN: INE1B4801017

The Cash Conversion Challenge

Strong sales growth is not yet translating into strong cash generation. Trade receivables swelled to ₹35.8 crore, up 41% since March, reports Radar. This ties up working capital, resulting in negative cash flow from operations before working capital changes. The company has a healthy cash balance of over ₹22 crore and no debt, funding its expansion from IPO proceeds.

Key Points

  • Revenue grew 47% YoY to ₹53 crore, driven by international expansion now contributing over 30% of sales.
  • Net profit growth of 20% YoY lagged revenue due to a 260-bps margin squeeze from higher depreciation and IPO-related costs.
  • Management guided for a 30-40% reduction in 'other expenses' next fiscal, offering a clear lever for margin improvement.
  • Working capital pressure is rising, with receivables up 41% sequentially, impacting cash conversion from operations.

Hexa Perspective

The quarter confirms Chatterbox is successfully scaling its top line through geographic and client diversification. The margin compression, however, underscores the 'investment year' thesis—growth is being bought at a cost to current profitability.

The outlook hinges on two factors: the normalization of IPO-related expenses and the conversion of receivables into cash. If the expense guidance holds, margins have a visible path to recovery in FY28. Until then, the stock's deep discount to the industry PE reflects the market's patience for that earnings catch-up.

Share or follow HexaWealth

Also read

Want this applied to your portfolio?

Talk to a HexaWealth advisor, or sync your mutual fund data for insights tailored to your holdings.
Chatterbox Technologies (CHTR) Q2 FY27 results, revenue and profits.

Frequently asked questions

What were Chatterbox Technologies' Q2 FY27 results?
Chatterbox Technologies reported Q2 FY27 revenue of ₹53 crore, a 47% increase year-on-year. Net profit for the quarter was ₹6 crore, up 20% from the same period last year. The net profit margin stood at 11.3%, down from 13.9% in Q2 FY26.
Why did Chatterbox Technologies' profit grow slower than revenue in Q2 FY27?
Chatterbox's profit grew 20% YoY, lagging its 47% revenue growth, due to a significant rise in expenses. Total expenses increased 54% YoY, driven by higher depreciation from capex and a surge in 'other expenses' linked to IPO-related PR, legal costs, and new office rent, as per management commentary.
What drove Chatterbox Technologies' 47% YoY revenue growth in Q2 FY27?
The 47% revenue growth was primarily driven by aggressive international expansion. Management stated that international markets now contribute over 30% of revenue, with the newly operational Dubai hub acting as a key gateway. Export revenue surged more than six-fold year-on-year.
What is Chatterbox Technologies' margin guidance for FY27?
Management has not provided a specific numerical margin target for FY27. However, the CFO guided for a 30-40% reduction in 'other expenses' in the next financial year as IPO costs normalize, which is expected to aid margin recovery towards previous levels of 14-15%.
How is Chatterbox Technologies' cash flow and working capital position?
Cash conversion is under pressure despite profit growth. Trade receivables increased 41% sequentially to ₹35.8 crore, reports Radar, tying up working capital. This led to negative cash flow from operations before working capital changes, though the company maintains a cash balance of over ₹22 crore with no debt.
What caused the 100% YoY increase in depreciation for Chatterbox?
Depreciation doubled year-on-year due to increased capital expenditure. The company has been investing in digital infrastructure, studios, and technology platforms, utilizing proceeds from its IPO, which led to a higher base of assets being depreciated.
What is the outlook for Chatterbox Technologies' international business?
The outlook is positive, with international markets already contributing over 30% of H1 FY27 revenue. The Dubai hub is fully operational, though management noted its initial ramp was affected by regional geopolitical events. The company sees international expansion as a key long-term growth driver.
Did Chatterbox Technologies' Q2 FY27 results beat analyst estimates?
Available reports do not specify consensus analyst estimates for Q2 FY27. The results showed a strong revenue beat compared to year-ago levels, but the market reaction likely incorporated the margin performance and working capital dynamics.
Are mutual funds or FIIs increasing their stake in Chatterbox Technologies?
As of September 2026, FII ownership increased slightly to 3.05% from 2.44% in June, per shareholding data. DII holdings decreased to 5.78% from 6.66%. Promoter holding remained steady at 60.39%.
Chatterbox Technologies Q2 FY27 results order book
The company does not disclose a traditional order book. However, it executed nearly 1,500 campaigns in H1 FY27 for over 500 brands, with a 71% client retention rate. Management highlighted the festive season from October to December as a period of focused budget execution.
Chatterbox Technologies Q2 FY27 results August 2026
Chatterbox Technologies reported its Q2 FY27 (quarter ended September 2026) results in November 2026. Revenue was ₹53 crore, and net profit was ₹6 crore. The results were approved by the board and followed by an earnings call on November 19, 2026.
Why did Chatterbox Technologies profits plunge despite higher sales?
Chatterbox's profit growth of 20% lagged its 47% sales growth because expenses rose even faster. A significant increase in depreciation and IPO-related 'other expenses' compressed margins, preventing profits from keeping pace with the strong top-line performance.