All posts

Follow Us

LinkedInInstagramX
Quarterly ResultsArchiveLast updated 11 November 20262 min read

Bafna Pharmaceuticals (BAFNAPH) Q2 FY27 Profit Doubles on Surging Revenue and Sharper Margins

The company's September quarter profit surged 120% year-on-year, driven by a 34% revenue jump and significant operating leverage.

By Abhinav Singhvi, Founder & CEO Hexawealth · Created 11 November 2026

Bafna Pharmaceuticals reported a 120% surge in net profit for Q2 FY27, reaching ₹6.85 crore. Revenue grew 34% to ₹47.67 crore, with the net profit margin expanding to 14.4% from 8.8% a year ago.

For Bafna Pharmaceuticals, the September quarter was a sharp recovery from a muted June period, turning strong sales into even stronger profits. The company’s net profit more than doubled year-on-year, reaching ₹6.85 crore, as revenue jumped 34% to ₹47.67 crore.

The numbers show a clear shift. While revenue grew robustly, total expenses rose at a slower 25% pace, creating significant operating leverage. This pushed the net profit margin to 14.4%, a 560 basis point improvement from the same quarter last year.

Revenue & profit

Revenue (₹ Cr)

Profit (₹ Cr)

Revenue & profitQ2 FY26 (Sep 2025) 35.47, Q3 FY26 (Dec 2025) 38.29, Q4 FY26 (Mar 2026) 42.24, Q1 FY27 (Jun 2026) 26.58, Q2 FY27 (Sep 2026) 47.67. Q2 FY26 (Sep 2025) 3.12, Q3 FY26 (Dec 2025) 1.84, Q4 FY26 (Mar 2026) 2.75, Q1 FY27 (Jun 2026) 0.07, Q2 FY27 (Sep 2026) 6.85020406080Q2 '26Q3 '26Q4 '26Q1 '27Q2 '27
  • Revenue (₹ Cr), Q2 FY26 (Sep 2025): 35.47
  • Revenue (₹ Cr), Q3 FY26 (Dec 2025): 38.29
  • Revenue (₹ Cr), Q4 FY26 (Mar 2026): 42.24
  • Revenue (₹ Cr), Q1 FY27 (Jun 2026): 26.58
  • Revenue (₹ Cr), Q2 FY27 (Sep 2026): 47.67
  • Profit (₹ Cr), Q2 FY26 (Sep 2025): 3.12
  • Profit (₹ Cr), Q3 FY26 (Dec 2025): 1.84
  • Profit (₹ Cr), Q4 FY26 (Mar 2026): 2.75
  • Profit (₹ Cr), Q1 FY27 (Jun 2026): 0.07
  • Profit (₹ Cr), Q2 FY27 (Sep 2026): 6.85

Revenue (₹ Cr)

Revenue (₹ Cr)Q2 FY26 (Sep 2025) 35.47, Q3 FY26 (Dec 2025) 38.29, Q4 FY26 (Mar 2026) 42.24, Q1 FY27 (Jun 2026) 26.58, Q2 FY27 (Sep 2026) 47.67020406080Q2 '26Q3 '26Q4 '26Q1 '27Q2 '27
  • Revenue (₹ Cr), Q2 FY26 (Sep 2025): 35.47
  • Revenue (₹ Cr), Q3 FY26 (Dec 2025): 38.29
  • Revenue (₹ Cr), Q4 FY26 (Mar 2026): 42.24
  • Revenue (₹ Cr), Q1 FY27 (Jun 2026): 26.58
  • Revenue (₹ Cr), Q2 FY27 (Sep 2026): 47.67

Profit (₹ Cr)

Profit (₹ Cr)Q2 FY26 (Sep 2025) 3.12, Q3 FY26 (Dec 2025) 1.84, Q4 FY26 (Mar 2026) 2.75, Q1 FY27 (Jun 2026) 0.07, Q2 FY27 (Sep 2026) 6.8502468Q2 '26Q3 '26Q4 '26Q1 '27Q2 '27
  • Profit (₹ Cr), Q2 FY26 (Sep 2025): 3.12
  • Profit (₹ Cr), Q3 FY26 (Dec 2025): 1.84
  • Profit (₹ Cr), Q4 FY26 (Mar 2026): 2.75
  • Profit (₹ Cr), Q1 FY27 (Jun 2026): 0.07
  • Profit (₹ Cr), Q2 FY27 (Sep 2026): 6.85

Net Profit Margin (%)

Net Profit Margin (%)Q2 FY26 (Sep 2025) 8.8, Q3 FY26 (Dec 2025) 4.8, Q4 FY26 (Mar 2026) 6.5, Q1 FY27 (Jun 2026) 0.3, Q2 FY27 (Sep 2026) 14.40%5%10%15%20%Q2 '26Q3 '26Q4 '26Q1 '27Q2 '27
  • Net Profit Margin (%), Q2 FY26 (Sep 2025): 8.8
  • Net Profit Margin (%), Q3 FY26 (Dec 2025): 4.8
  • Net Profit Margin (%), Q4 FY26 (Mar 2026): 6.5
  • Net Profit Margin (%), Q1 FY27 (Jun 2026): 0.3
  • Net Profit Margin (%), Q2 FY27 (Sep 2026): 14.4
MetricCurrentQ2 FY27 (Sep 2026)PreviousQ1 FY27 (Jun 2026)
Revenue (₹ Cr)
47.67
26.58
Profit (₹ Cr)
6.85
0.07
Net Profit Margin (%)
14.4
0.3

The cost discipline behind the margin surge

The margin expansion was driven by disciplined cost management. According to a report by scanx.trade, the cost of materials consumed rose only 9.8% year-on-year, far slower than the 34% revenue growth. This divergence was the key driver behind the profit surge.

Higher depreciation and interest costs, up 27% and 18% respectively, reflect ongoing capital expenditure. The company’s total assets grew to ₹193 crore by September 2026 from ₹175.5 crore in March, indicating investment in capacity.

A balance sheet funding growth

This expansion is consuming cash. Scanx.trade notes that while operations generated ₹10 crore in cash over the half-year, investing activities used ₹8.9 crore, primarily for capex. Trade receivables and inventories also rose, signaling higher working capital needs.

Live Chart

· BAFNAPH

(BSE)

ISIN: INE878I01022

Management, as cited by StockFin.ai, is focused on strategic expansion into regulated markets and maintaining a minimum-debt status. The company aims for an EBITDA margin of at least 15%, a target it exceeded this quarter with an 18% margin reported by sahi.com.

Key Points

  • Net profit surged 120% year-on-year to ₹6.85 crore, rebounding sharply from a marginal profit in the previous quarter.
  • Revenue growth of 34% to ₹47.67 crore was amplified by operating leverage, with material costs rising less than 10%.
  • The net profit margin expanded to 14.4%, a 560 basis point improvement, driven by disciplined expense management.
  • The balance sheet shows asset growth and higher working capital, funded by operational cash flow and supporting ongoing expansion plans.

Hexa Perspective

The quarter demonstrates Bafna Pharma’s ability to convert top-line momentum into bottom-line gains through cost control. The challenge is sustaining this margin profile as the company invests for growth, which is already evident in rising capital expenditure and working capital.

The focus on regulated markets and a target EBITDA margin above 15% provides a clear benchmark. Execution on new product filings and managing the balance between growth investment and financial discipline will determine if this quarter’s performance is a new baseline or a peak.

Share or follow HexaWealth

Also read

Want this applied to your portfolio?

Talk to a HexaWealth advisor, or sync your mutual fund data for insights tailored to your holdings.
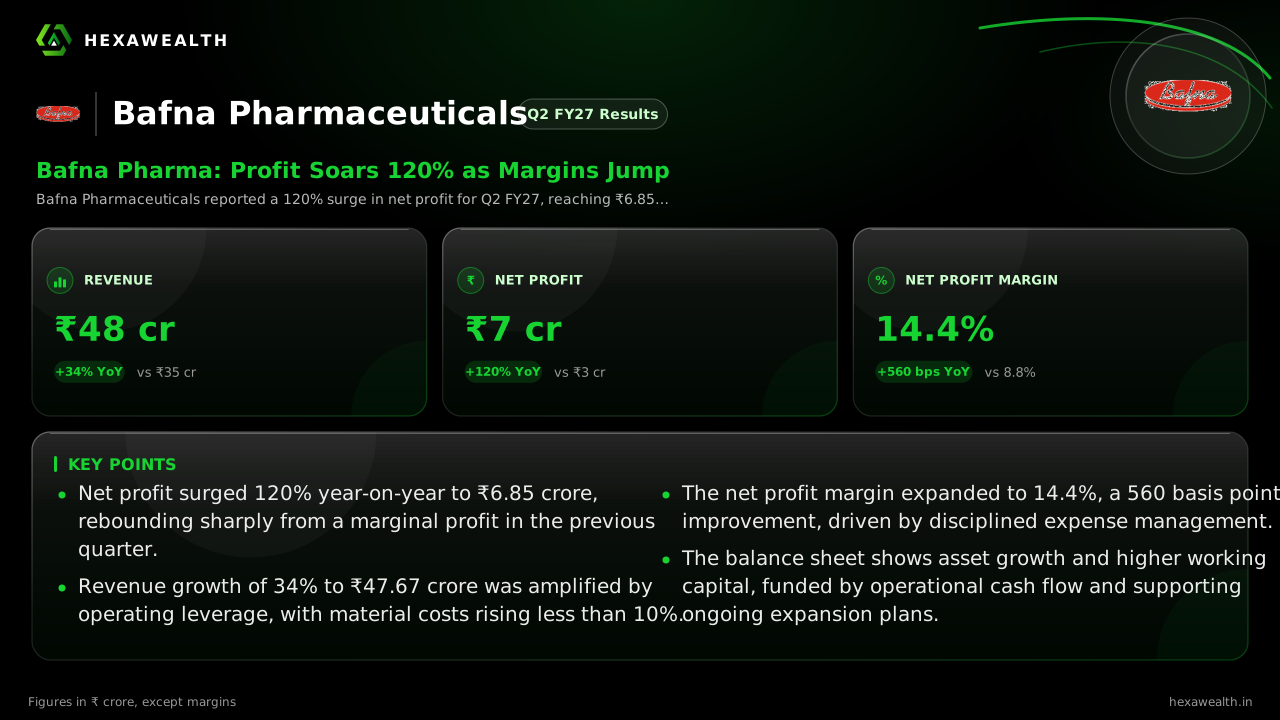
Bafna Pharmaceuticals (BAFNAPH) Q2 FY27 results, revenue and profits.

Frequently asked questions

What were Bafna Pharmaceuticals' Q2 FY27 results?
Bafna Pharmaceuticals reported a net profit of ₹6.85 crore for Q2 FY27 (September 2026 quarter), a 120% increase year-on-year. Revenue for the quarter was ₹47.67 crore, up 34% from the same period last year. The net profit margin expanded significantly to 14.4%.
Why did Bafna Pharmaceuticals' Q2 FY27 profit jump 120%?
Bafna Pharma's profit jumped due to a 34% surge in revenue combined with strong operating leverage. As reported by scanx.trade, the cost of materials rose only 9.8% year-on-year, much slower than revenue growth, leading to a major expansion in the net profit margin to 14.4%.
What was Bafna Pharmaceuticals' net profit margin in Q2 FY27?
Bafna Pharmaceuticals' net profit margin was 14.4% in Q2 FY27 (September 2026 quarter). This marks a significant improvement of 560 basis points from the 8.8% margin reported in the same quarter of the previous fiscal year.
How did Bafna Pharmaceuticals' Q2 FY27 revenue compare to the previous quarter?
Bafna Pharma's Q2 FY27 revenue of ₹47.67 crore was 79% higher than the ₹26.58 crore reported in Q1 FY27 (June 2026 quarter). This sequential surge helped drive a massive recovery in profit from a marginal ₹0.07 crore to ₹6.85 crore.
What is Bafna Pharmaceuticals' management outlook after Q2 FY27?
Management, as cited by StockFin.ai, is focused on strategic expansion into regulated markets with plans to file 6–8 new product dossiers. The company aims to maintain a minimum-debt status and targets an EBITDA margin of at least 15%, a level it exceeded this quarter.
What is the status of Bafna Pharmaceuticals' balance sheet and debt?
As of September 2026, total assets grew to ₹193 crore. According to scanx.trade, current borrowings stood at ₹22.96 crore and non-current borrowings at ₹14.23 crore. The company used operational cash flow to fund ₹8.9 crore in capital expenditure over the half-year.
Did Bafna Pharmaceuticals' Q2 results beat analyst estimates?
No verified analyst consensus was publicly available ahead of the results, as noted by a Univest preview. The performance was measured against the company's own year-ago base of ₹35.47 crore in revenue and a ₹3.12 crore profit, both of which were significantly exceeded.
Are institutional investors changing their stake in Bafna Pharmaceuticals?
Shareholding has remained stable recently. Data from StockFin.ai shows promoter holding steady at 75%, with Foreign Institutional Investor (FII) holding consistent at 9.34% for Q1 and Q2 FY27. There has been no significant institutional selling or buying disclosed post-results.
What are Bafna Pharmaceuticals' capacity expansion plans?
The company is actively investing in capacity, with half-year capex of ₹8.9 crore reported by scanx.trade. Management, per StockFin.ai, emphasizes expansion into regulated markets and R&D, targeting 60% solar power usage, but has not disclosed new near-term capital fundraising plans.
What was Bafna Pharmaceuticals' EBITDA in Q2 FY27?
According to reports from sahi.com and scanx.trade, Bafna Pharmaceuticals' EBITDA for Q2 FY27 was ₹8.6 crore. This represents a 101% increase year-on-year, driving the EBITDA margin to 18.05% from 12.07% in Q2 FY26.
Bafna Pharmaceuticals Q2 profit drop?
Bafna Pharmaceuticals did not experience a profit drop in Q2 FY27. On the contrary, net profit surged 120% year-on-year to ₹6.85 crore, a massive sequential recovery from the ₹0.07 crore profit in Q1 FY27.
Bafna Pharmaceuticals Q2 net profit?
Bafna Pharmaceuticals' Q2 FY27 (September 2026 quarter) net profit was ₹6.85 crore. This is a significant increase from the ₹3.12 crore net profit reported in the same quarter of the previous fiscal year.