(WIPL) Q2 FY27 Western Indian Plywoods' Profit Jumps 263% on a Sliver of Revenue Growth
The plywood maker swung to a quarterly profit despite modest sales, but a volatile history and premium valuation temper the recovery story.
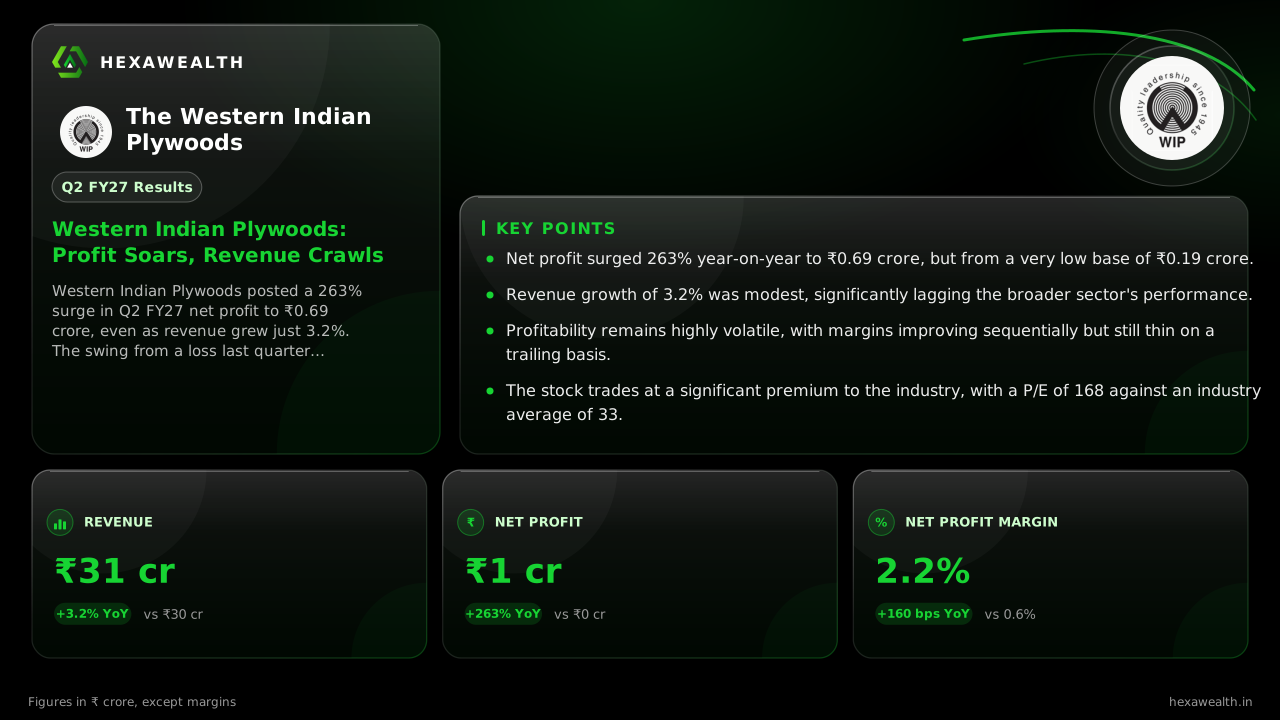
Western Indian Plywoods posted a 263% surge in Q2 FY27 net profit to ₹0.69 crore, even as revenue grew just 3.2%. The swing from a loss last quarter highlights margin improvement, but the company's earnings remain volatile against a challenging sector backdrop.
For a small plywood manufacturer, consistent profitability is often elusive amid timber cost swings and thin margins. Western Indian Plywoods found a brief window in the September quarter, turning a modest sales increase into a sharp profit rebound.
The numbers show a business on two tracks. Revenue grew 3.2% year-on-year to ₹30.89 crore. Profit, however, leapt 263% to ₹0.69 crore from a low base.
Revenue & profit
Revenue (₹ Cr)
Profit (₹ Cr)
- Revenue (₹ Cr), Q2 FY26 (Sep 2025): 29.92
- Revenue (₹ Cr), Q3 FY26 (Dec 2025): 31.45
- Revenue (₹ Cr), Q4 FY26 (Mar 2026): 28.50
- Revenue (₹ Cr), Q1 FY27 (Jun 2026): 26.49
- Revenue (₹ Cr), Q2 FY27 (Sep 2026): 30.89
- Profit (₹ Cr), Q2 FY26 (Sep 2025): 0.19
- Profit (₹ Cr), Q3 FY26 (Dec 2025): 0.83
- Profit (₹ Cr), Q4 FY26 (Mar 2026): -0.91
- Profit (₹ Cr), Q1 FY27 (Jun 2026): -0.30
- Profit (₹ Cr), Q2 FY27 (Sep 2026): 0.69
Revenue (₹ Cr)
- Revenue (₹ Cr), Q2 FY26 (Sep 2025): 29.92
- Revenue (₹ Cr), Q3 FY26 (Dec 2025): 31.45
- Revenue (₹ Cr), Q4 FY26 (Mar 2026): 28.50
- Revenue (₹ Cr), Q1 FY27 (Jun 2026): 26.49
- Revenue (₹ Cr), Q2 FY27 (Sep 2026): 30.89
Profit (₹ Cr)
- Profit (₹ Cr), Q2 FY26 (Sep 2025): 0.19
- Profit (₹ Cr), Q3 FY26 (Dec 2025): 0.83
- Profit (₹ Cr), Q4 FY26 (Mar 2026): -0.91
- Profit (₹ Cr), Q1 FY27 (Jun 2026): -0.30
- Profit (₹ Cr), Q2 FY27 (Sep 2026): 0.69
Net Profit Margin
- Net Profit Margin, Q2 FY26 (Sep 2025): 0.6%
- Net Profit Margin, Q3 FY26 (Dec 2025): 2.6%
- Net Profit Margin, Q4 FY26 (Mar 2026): -3.2%
- Net Profit Margin, Q1 FY27 (Jun 2026): -1.1%
- Net Profit Margin, Q2 FY27 (Sep 2026): 2.2%
| Metric | CurrentQ2 FY27 (Sep 2026) | PreviousQ1 FY27 (Jun 2026) |
|---|---|---|
| Revenue (₹ Cr) | 30.89 | 26.49 |
| Profit (₹ Cr) | 0.69 | -0.30 |
| Net Profit Margin | 2.2% | -1.1% |
The sequential story is more telling. Revenue jumped 16.6% from a weak June quarter, pulling the company out of a loss. A key driver was a significant improvement in operating leverage, with operating profit rising 83% year-on-year to ₹1.50 crore, as reported by Univest.
The Margin Mirage
This profit swing came despite a 10.7% rise in total expenses. The gain was powered by a 330 basis-point sequential jump in net profit margin. Employee costs fell 5%, providing some relief.
Yet, the underlying business remains fragile. The trailing twelve-month net profit margin is just 0.3%, and return on equity was a low 1.01% in FY26. Profit has swung from a ₹0.91 crore loss to a ₹0.83 crore profit over the past five quarters.
Live Chart
· WIPL
(BSE)
ISIN: INE215F01023
A Sector Out of Step
The company's modest growth contrasts with a stronger sector. A Flash Finance tracker shows the plywood and laminates segment saw combined sales grow 18.2% year-on-year in Q2 FY27. Western Indian Plywoods' 3.2% growth places it at the lower end.
Larger peers like Century Plyboards are guiding for robust full-year growth and expanding capacity. This highlights the competitive gap a smaller, regional player faces in scaling up.
Key Points
- Net profit surged 263% year-on-year to ₹0.69 crore, but from a very low base of ₹0.19 crore.
- Revenue growth of 3.2% was modest, significantly lagging the broader sector's performance.
- Profitability remains highly volatile, with margins improving sequentially but still thin on a trailing basis.
- The stock trades at a significant premium to the industry, with a P/E of 168 against an industry average of 33.
Hexa Perspective
The quarter shows Western Indian Plywoods can generate profit when sales volume picks up and costs are contained. However, the sustainability of this recovery is the central question.
The company's history of volatile earnings and low returns on capital suggest this may be a cyclical uptick rather than a structural turnaround. For the momentum to hold, it requires steady demand to absorb its fixed costs, a challenge in a competitive market where it is not the scale player. Investors are left weighing a sharp quarterly bounce against a multi-year trend of fragility.
Also read
Want this applied to your portfolio?
Talk to a HexaWealth advisor, or sync your mutual fund data for insights tailored to your holdings.