Vibrant Global (VGCL) Q2 FY27 Profit Jumps 221% Despite Revenue Dip
Vibrant Global Capital's Q2 FY27 profit soared 221% year-on-year, but a sequential revenue drop and margin compression point to underlying volatility.
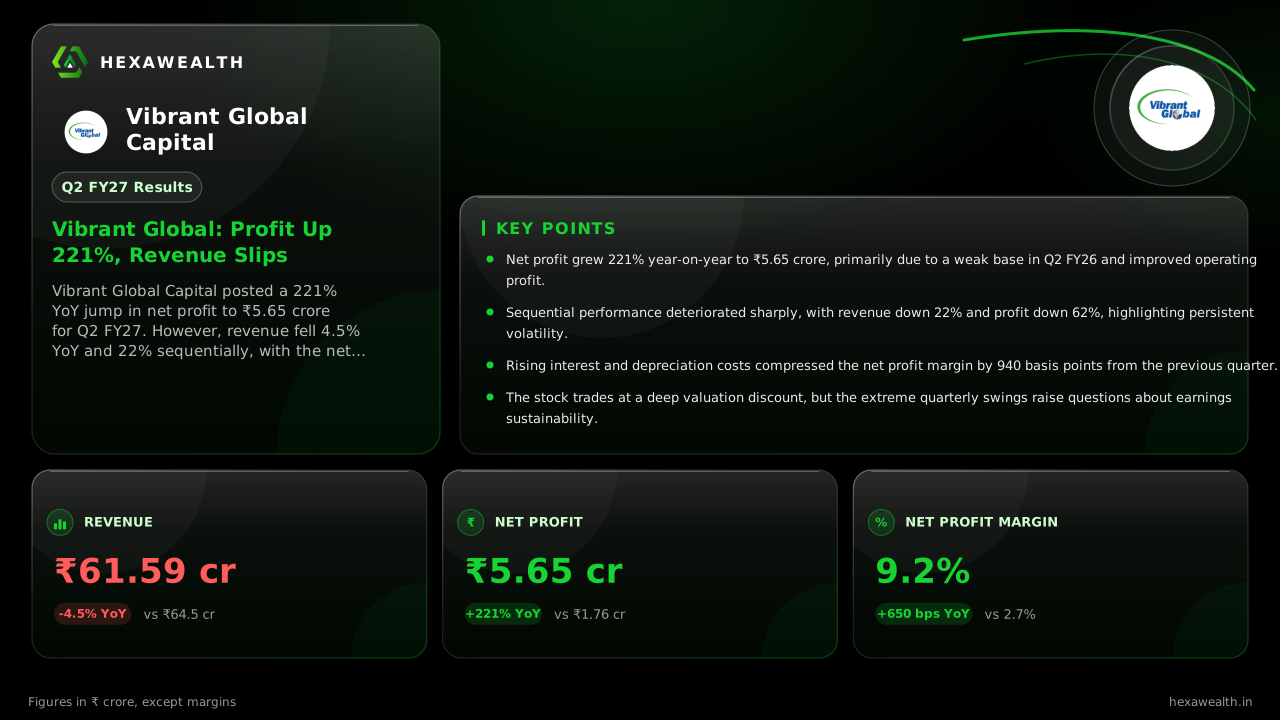
Vibrant Global Capital posted a 221% YoY jump in net profit to ₹5.65 crore for Q2 FY27. However, revenue fell 4.5% YoY and 22% sequentially, with the net profit margin contracting sharply from the previous quarter.
For Vibrant Global Capital, a quarter that looks like a strong recovery on paper reveals a business still grappling with its own volatility. The NBFC's profit more than tripled from a year ago, but a sharp sequential drop in sales and margins shows the gains are fragile.
The numbers tell two different stories. Year-on-year, net profit surged 221% to ₹5.65 crore even as revenue slipped 4.5% to ₹61.59 crore. Sequentially, the picture reverses: profit fell 62% and revenue dropped 22% from a bumper Q1.
Revenue & profit
Revenue (₹ Cr)
Profit (₹ Cr)
- Revenue (₹ Cr), Q2 FY26 (Sep '25): 64.50
- Revenue (₹ Cr), Q3 FY26 (Dec '25): 35.04
- Revenue (₹ Cr), Q4 FY26 (Mar '26): 45.09
- Revenue (₹ Cr), Q1 FY27 (Jun '26): 79.28
- Revenue (₹ Cr), Q2 FY27 (Sep '26): 61.59
- Profit (₹ Cr), Q2 FY26 (Sep '25): 1.76
- Profit (₹ Cr), Q3 FY26 (Dec '25): 2.86
- Profit (₹ Cr), Q4 FY26 (Mar '26): 7.52
- Profit (₹ Cr), Q1 FY27 (Jun '26): 14.75
- Profit (₹ Cr), Q2 FY27 (Sep '26): 5.65
Revenue (₹ Cr)
- Revenue (₹ Cr), Q2 FY26 (Sep '25): 64.50
- Revenue (₹ Cr), Q3 FY26 (Dec '25): 35.04
- Revenue (₹ Cr), Q4 FY26 (Mar '26): 45.09
- Revenue (₹ Cr), Q1 FY27 (Jun '26): 79.28
- Revenue (₹ Cr), Q2 FY27 (Sep '26): 61.59
Profit (₹ Cr)
- Profit (₹ Cr), Q2 FY26 (Sep '25): 1.76
- Profit (₹ Cr), Q3 FY26 (Dec '25): 2.86
- Profit (₹ Cr), Q4 FY26 (Mar '26): 7.52
- Profit (₹ Cr), Q1 FY27 (Jun '26): 14.75
- Profit (₹ Cr), Q2 FY27 (Sep '26): 5.65
Net Profit Margin
- Net Profit Margin, Q2 FY26 (Sep '25): 2.7%
- Net Profit Margin, Q3 FY26 (Dec '25): 8.2%
- Net Profit Margin, Q4 FY26 (Mar '26): 16.7%
- Net Profit Margin, Q1 FY27 (Jun '26): 18.6%
- Net Profit Margin, Q2 FY27 (Sep '26): 9.2%
| Metric | CurrentQ2 FY27 (Sep '26) | PreviousQ1 FY27 (Jun '26) |
|---|---|---|
| Revenue (₹ Cr) | 61.59 | 79.28 |
| Profit (₹ Cr) | 5.65 | 14.75 |
| Net Profit Margin | 9.2% | 18.6% |
Why the profit jumped on lower sales
The dramatic year-on-year profit growth stems from a weak base. Q2 FY26 was a poor quarter with a net profit margin of just 2.7%. MarketsMojo notes that operating profit before depreciation and interest rose 162% YoY to ₹10.27 crore, driving the improvement.
This operating leverage came from better cost control relative to the year-ago period. Total expenses were contained, allowing profit to expand even on a slightly smaller revenue base.
The costs that won't go away
While the YoY comparison flatters, the quarter-on-quarter decline is more telling. Revenue fell 22% and profit dropped 62%. ReportsRadar notes the trading and manufacturing segments reported losses this quarter.
Live Chart
· VGCL
(BSE)
ISIN: INE761Q01015
MarketsMojo points to a 72% sequential rise in interest costs and a near-doubling of depreciation as key pressures. These fixed costs, combined with lower revenue, created significant operating leverage headwinds, compressing the net profit margin by 940 basis points.
A market reading the volatility
The stock's reaction has been muted, reflecting the mixed signals. It trades at a significant discount, with a P/E of 3.9 against an industry average of 18.1. This deep value gap, as MarketsMojo suggests, presents a classic 'value trap' scenario given the operational volatility.
With no management guidance accompanying the results, the outlook rests on whether the company can stabilize its revenue streams. The recent acquisition of a wealth management platform, noted by Alfafinder, is a forward-looking bet but is not yet operational.
Key Points
- Net profit grew 221% year-on-year to ₹5.65 crore, primarily due to a weak base in Q2 FY26 and improved operating profit.
- Sequential performance deteriorated sharply, with revenue down 22% and profit down 62%, highlighting persistent volatility.
- Rising interest and depreciation costs compressed the net profit margin by 940 basis points from the previous quarter.
- The stock trades at a deep valuation discount, but the extreme quarterly swings raise questions about earnings sustainability.
Hexa Perspective
The quarter underscores a business caught between recovery and instability. The year-on-year profit leap is real but built on easy comparisons, while the sequential slump shows core revenue remains unpredictable.
Investors are left weighing a rock-bottom valuation against erratic fundamentals. For the discount to narrow, Vibrant Global needs to demonstrate it can generate steady top-line growth. Until then, the stock's appeal is purely for those betting on a turnaround that has yet to find a consistent footing.
Also read
Want this applied to your portfolio?
Talk to a HexaWealth advisor, or sync your mutual fund data for insights tailored to your holdings.