Veljan Denison (VELJAN) Q2 FY27 Profit Falls 7% as Costs Outpace Revenue Growth
The hydraulic equipment maker posted a 14% yearly revenue gain, but a sharp margin contraction led to a sequential drop in quarterly profit.
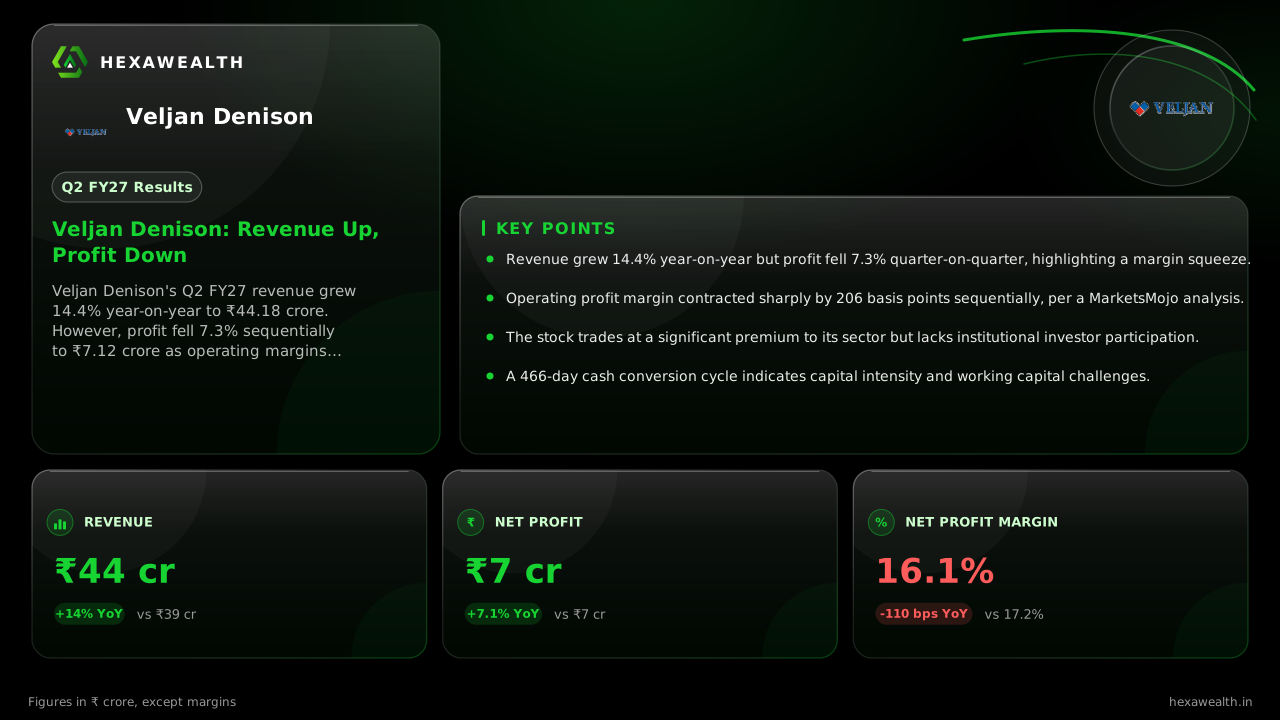
Veljan Denison's Q2 FY27 revenue grew 14.4% year-on-year to ₹44.18 crore. However, profit fell 7.3% sequentially to ₹7.12 crore as operating margins compressed, highlighting cost pressures in the niche engineering sector.
For a niche hydraulic equipment maker, steady demand from construction and industrial machinery is the baseline. Veljan Denison's September quarter met that test with a 14% yearly sales gain, but the cost of delivering that growth bit into profits.
The numbers show a business where top-line momentum is not translating down the income statement. Revenue reached ₹44.18 crore, up 1.6% from the June quarter. Profit, however, slipped 7.3% sequentially to ₹7.12 crore.
Revenue & profit
Revenue (₹ Cr)
Profit (₹ Cr)
- Revenue (₹ Cr), Q2 FY26 (Sep 2025): 38.63
- Revenue (₹ Cr), Q3 FY26 (Dec 2025): 36.92
- Revenue (₹ Cr), Q4 FY26 (Mar 2026): 45.91
- Revenue (₹ Cr), Q1 FY27 (Jun 2026): 43.48
- Revenue (₹ Cr), Q2 FY27 (Sep 2026): 44.18
- Profit (₹ Cr), Q2 FY26 (Sep 2025): 6.65
- Profit (₹ Cr), Q3 FY26 (Dec 2025): 5.06
- Profit (₹ Cr), Q4 FY26 (Mar 2026): 6.79
- Profit (₹ Cr), Q1 FY27 (Jun 2026): 7.68
- Profit (₹ Cr), Q2 FY27 (Sep 2026): 7.12
Revenue (₹ Cr)
- Revenue (₹ Cr), Q2 FY26 (Sep 2025): 38.63
- Revenue (₹ Cr), Q3 FY26 (Dec 2025): 36.92
- Revenue (₹ Cr), Q4 FY26 (Mar 2026): 45.91
- Revenue (₹ Cr), Q1 FY27 (Jun 2026): 43.48
- Revenue (₹ Cr), Q2 FY27 (Sep 2026): 44.18
Profit (₹ Cr)
- Profit (₹ Cr), Q2 FY26 (Sep 2025): 6.65
- Profit (₹ Cr), Q3 FY26 (Dec 2025): 5.06
- Profit (₹ Cr), Q4 FY26 (Mar 2026): 6.79
- Profit (₹ Cr), Q1 FY27 (Jun 2026): 7.68
- Profit (₹ Cr), Q2 FY27 (Sep 2026): 7.12
Net Profit Margin
- Net Profit Margin, Q2 FY26 (Sep 2025): 17.2%
- Net Profit Margin, Q3 FY26 (Dec 2025): 13.7%
- Net Profit Margin, Q4 FY26 (Mar 2026): 14.8%
- Net Profit Margin, Q1 FY27 (Jun 2026): 17.7%
- Net Profit Margin, Q2 FY27 (Sep 2026): 16.1%
| Metric | CurrentQ2 FY27 (Sep 2026) | PreviousQ1 FY27 (Jun 2026) |
|---|---|---|
| Revenue (₹ Cr) | 44.18 | 43.48 |
| Profit (₹ Cr) | 7.12 | 7.68 |
| Net Profit Margin | 16.1% | 17.7% |
Why the margin shrank
The profit drop stems from a 160-basis-point sequential compression in net profit margin. A MarketsMojo report notes the operating profit margin, excluding other income, contracted sharply by 206 basis points to 23.70%. While employee costs were stable, other operational expenses rose faster than sales.
This margin pressure overshadowed a helpful 66% yearly jump in other income, which reached ₹1.24 crore. The higher tax rate of 27.94%, up from 26.93% last quarter, also weighed on the final profit number.
The long cycle ahead
Veljan’s business model involves a 466-day cash conversion cycle, as noted by SectorAlpha. This means capital stays tied up in inventory and receivables for over 15 months. While the company is virtually debt-free, this elongated cycle limits how quickly it can respond to cost swings.
Live Chart
· VELJAN
(BSE)
ISIN: INE232E01013
The broader hydraulic components market, driven by infrastructure and construction, is forecast to grow 7-10% annually. Yet producer prices for fabricated metal, a key input, rose 7.5% yearly in September 2026. Passing these costs on remains a challenge.
How the market read it
The stock had corrected nearly 27% in the month leading up to the results, significantly underperforming the market. MarketsMojo assigns the stock a 'Hold' score of 51/100, calling its valuation 'very expensive' at a P/E of 33.7x against modest growth.
Institutional validation is absent, with zero FII or mutual fund holdings. The investment case now hinges on reversing the margin trend, as top-line growth alone hasn't justified the premium.
Key Points
- Revenue grew 14.4% year-on-year but profit fell 7.3% quarter-on-quarter, highlighting a margin squeeze.
- Operating profit margin contracted sharply by 206 basis points sequentially, per a MarketsMojo analysis.
- The stock trades at a significant premium to its sector but lacks institutional investor participation.
- A 466-day cash conversion cycle indicates capital intensity and working capital challenges.
Hexa Perspective
This quarter underscores the tension in a niche engineering business. Demand visibility is present, but pricing power appears limited against rising input costs. The margin compression suggests operational efficiency gains are needed to protect profitability.
The valuation disconnect is stark. For the stock to sustain its levels, Veljan needs to demonstrate it can expand margins back towards its historical average while maintaining sales growth. Until then, the risk of further de-rating remains high, as the recent market correction implies.
Also read
Want this applied to your portfolio?
Talk to a HexaWealth advisor, or sync your mutual fund data for insights tailored to your holdings.