National Fertilizers (NFL) Q2 FY27 Profit Evaporates as Costs Swallow a 29% Sales Jump
A sharp sequential rise in sales was entirely offset by a surge in raw material and fuel expenses, leaving the state-owned fertilizer maker with a wafer-thin profit.
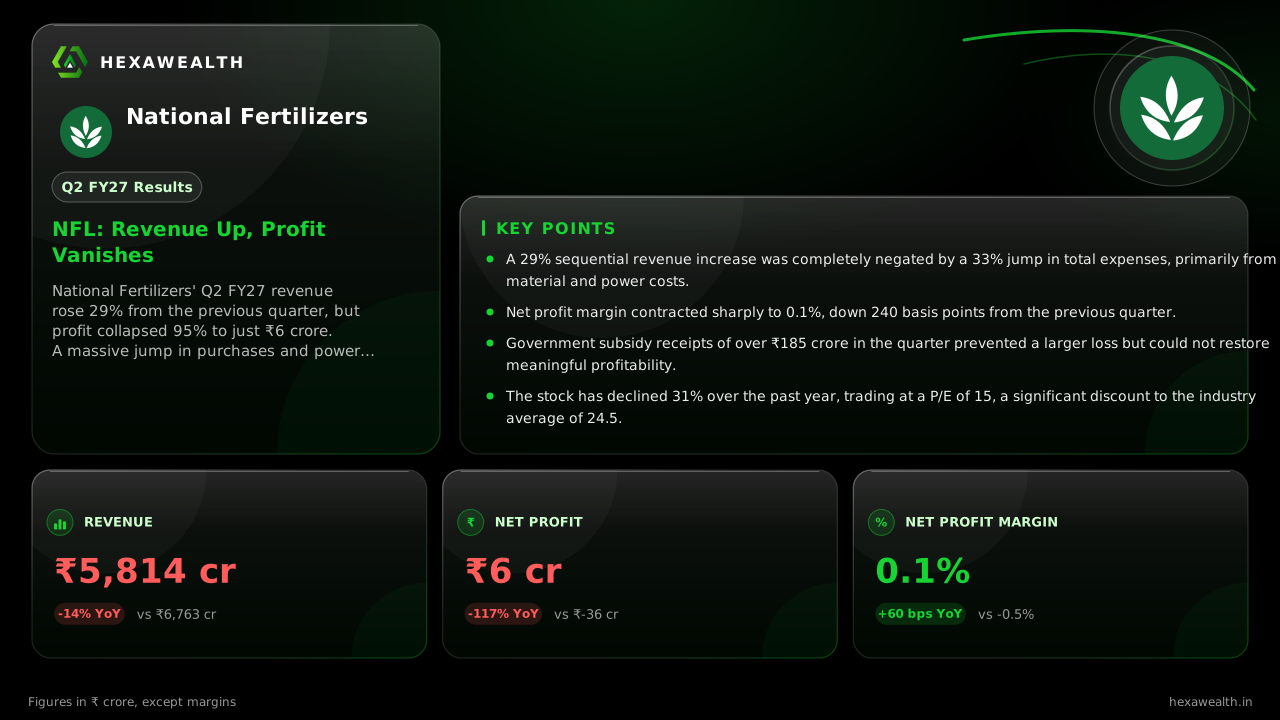
National Fertilizers' Q2 FY27 revenue rose 29% from the previous quarter, but profit collapsed 95% to just ₹6 crore. A massive jump in purchases and power costs erased gains, highlighting persistent margin pressure.
For a state-owned fertilizer maker, a quarter is defined by the interplay of subsidy flows, input costs, and seasonal demand. National Fertilizers’ September quarter saw sales recover from a low base, but the cost side of that equation broke down, leaving profitability nearly erased.
The numbers tell a story of two opposing forces. Revenue of ₹5,814 crore climbed 29% from the June quarter, yet net profit collapsed 95% to just ₹6.12 crore. The company’s net profit margin, which was 2.5% last quarter, shrank to a mere 0.1%.
Revenue & profit
Revenue (₹ Cr)
Profit (₹ Cr)
- Revenue (₹ Cr), Q2 FY26: 6,763.07
- Revenue (₹ Cr), Q3 FY26: 6,869.75
- Revenue (₹ Cr), Q4 FY26: 4,347.19
- Revenue (₹ Cr), Q1 FY27: 4,500.39
- Revenue (₹ Cr), Q2 FY27: 5,813.94
- Profit (₹ Cr), Q2 FY26: -35.81
- Profit (₹ Cr), Q3 FY26: 135.20
- Profit (₹ Cr), Q4 FY26: 151.54
- Profit (₹ Cr), Q1 FY27: 113.38
- Profit (₹ Cr), Q2 FY27: 6.12
Revenue (₹ Cr)
- Revenue (₹ Cr), Q2 FY26: 6,763.07
- Revenue (₹ Cr), Q3 FY26: 6,869.75
- Revenue (₹ Cr), Q4 FY26: 4,347.19
- Revenue (₹ Cr), Q1 FY27: 4,500.39
- Revenue (₹ Cr), Q2 FY27: 5,813.94
Profit (₹ Cr)
- Profit (₹ Cr), Q2 FY26: -35.81
- Profit (₹ Cr), Q3 FY26: 135.20
- Profit (₹ Cr), Q4 FY26: 151.54
- Profit (₹ Cr), Q1 FY27: 113.38
- Profit (₹ Cr), Q2 FY27: 6.12
Net Profit Margin (%)
- Net Profit Margin (%), Q2 FY26: -0.5
- Net Profit Margin (%), Q3 FY26: 2.0
- Net Profit Margin (%), Q4 FY26: 3.5
- Net Profit Margin (%), Q1 FY27: 2.5
- Net Profit Margin (%), Q2 FY27: 0.1
| Metric | CurrentQ2 FY27 | PreviousQ1 FY27 | Same quarter LYQ2 FY26 |
|---|---|---|---|
| Revenue (₹ Cr) | 5,813.94YoY -14% | 4,500.39 | 6,763.07 |
| Profit (₹ Cr) | 6.12YoY +117% | 113.38 | -35.81 |
| Net Profit Margin (%) | 0.1YoY +120% | 2.5 | -0.5 |
Where the sales gain went
A report from Multibagg.ai details the cost surge that wiped out the top-line growth. Purchases of stock-in-trade soared to ₹2,568 crore from ₹494 crore in the prior quarter. Power and fuel expense also jumped to ₹1,701 crore. These increases, attributed to higher raw material consumption, pushed total expenses up 33% sequentially.
This cost inflation occurred even as fertilizer prices in India were easing, according to an IMARC Group report. The domestic market absorbed volumes at weaker inquiry levels through the September period. The result was a classic margin squeeze: higher sales volumes at lower realizations, met with stubbornly high input costs.
The subsidy buffer
Government support provided a critical, though insufficient, cushion. National Fertilizers recognised ₹315.91 crore in subsidy income during the first half, as noted by Multibagg.ai. This included ₹185.50 crore booked in the September quarter for DAP and TSP fertilizers. Without this subsidy inflow, the quarterly loss would have been deeper.
Live Chart
· NFL
(BSE)
ISIN: INE870D01012
The company’s debt-equity ratio improved slightly to 1.60 times from 1.88 times in June, per the same report. Yet interest expense remains elevated, rising 36% year-on-year, likely linked to working capital needs for that inventory build-up.
Key Points
- A 29% sequential revenue increase was completely negated by a 33% jump in total expenses, primarily from raw material and power costs.
- Net profit margin contracted sharply to 0.1%, down 240 basis points from the previous quarter.
- Government subsidy receipts of over ₹185 crore in the quarter prevented a larger loss but could not restore meaningful profitability.
- The stock has declined 31% over the past year, trading at a P/E of 15, a significant discount to the industry average of 24.5.
Hexa Perspective
The quarter underscores National Fertilizers’ fundamental vulnerability to input cost volatility within a regulated pricing framework. The business model depends on subsidy timing and beating government energy norms to generate profit.
With global urea prices weak and domestic demand in a seasonal lull, the near-term outlook remains challenging. Profitability recovery hinges on a sustained drop in feedstock costs or a step-up in subsidy support, both factors largely outside management's direct control. Investors are pricing in this uncertainty, as reflected in the stock's deep discount to the sector.
Also read
Want this applied to your portfolio?
Talk to a HexaWealth advisor, or sync your mutual fund data for insights tailored to your holdings.