Kansai Nerolac (KANSAINER) Q2 FY27 Profit Plunges 37% as Margins Collapse Under Cost Pressure
The paintmaker's revenue grew 19% year-on-year, but a sharp sequential drop in profit highlights an intense margin squeeze from raw materials and competition.
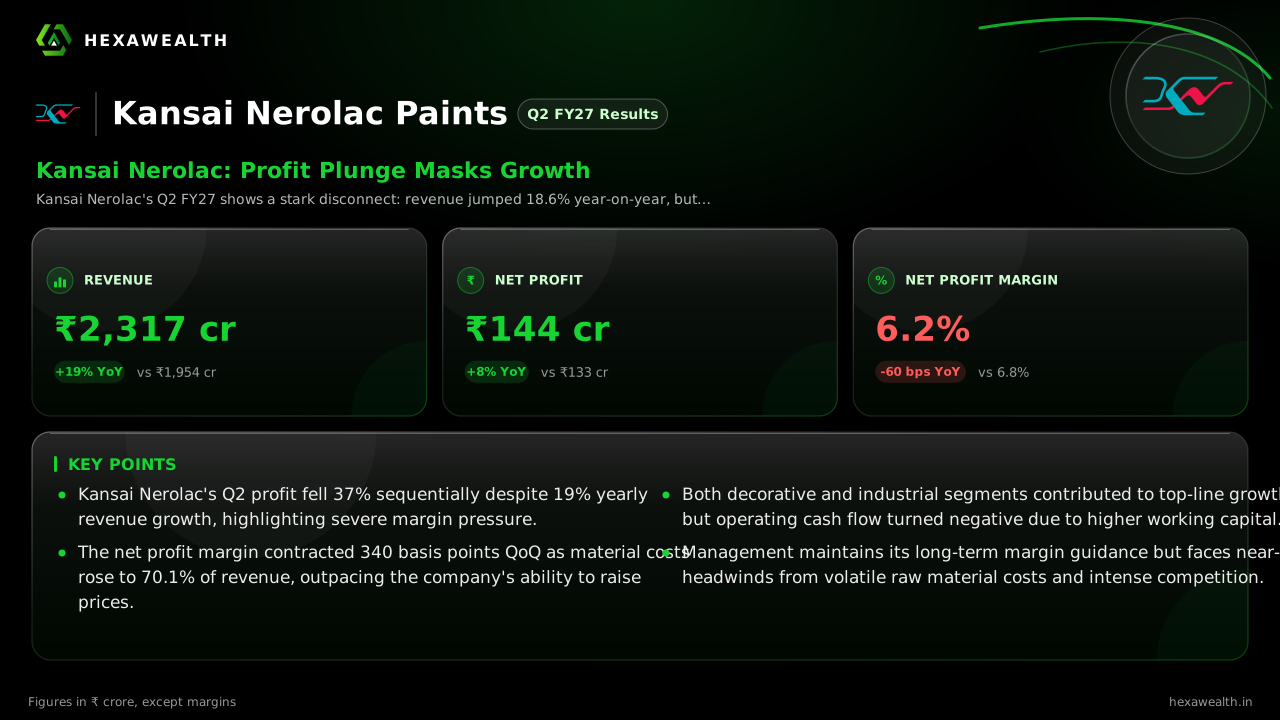
Kansai Nerolac's Q2 FY27 shows a stark disconnect: revenue jumped 18.6% year-on-year, but profit fell 37% from the previous quarter. The collapse was driven by a 340 basis point drop in net profit margin as material costs surged.
For Kansai Nerolac, the September quarter was a story of growth that could not reach the bottom line. The paintmaker delivered a solid 19% yearly sales increase, but profitability collapsed under the weight of surging input costs and a fiercely competitive market.
The numbers reveal the tension. Revenue stood at ₹2,317 crore, up 18.6% from a year ago but down 2.4% from the strong June quarter. Profit, however, fell sharply to ₹144 crore. That is an 8% yearly gain but a steep 37% drop sequentially.
Revenue & profit
Revenue (₹ Cr)
Profit (₹ Cr)
- Revenue (₹ Cr), Q2 FY26 (Sep 2025): 1,954.18
- Revenue (₹ Cr), Q3 FY26 (Dec 2025): 1,981.99
- Revenue (₹ Cr), Q4 FY26 (Mar 2026): 1,953.71
- Revenue (₹ Cr), Q1 FY27 (Jun 2026): 2,373.59
- Revenue (₹ Cr), Q2 FY27 (Sep 2026): 2,317.38
- Profit (₹ Cr), Q2 FY26 (Sep 2025): 133.31
- Profit (₹ Cr), Q3 FY26 (Dec 2025): 117.05
- Profit (₹ Cr), Q4 FY26 (Mar 2026): 109.89
- Profit (₹ Cr), Q1 FY27 (Jun 2026): 228.41
- Profit (₹ Cr), Q2 FY27 (Sep 2026): 143.99
Revenue (₹ Cr)
- Revenue (₹ Cr), Q2 FY26 (Sep 2025): 1,954.18
- Revenue (₹ Cr), Q3 FY26 (Dec 2025): 1,981.99
- Revenue (₹ Cr), Q4 FY26 (Mar 2026): 1,953.71
- Revenue (₹ Cr), Q1 FY27 (Jun 2026): 2,373.59
- Revenue (₹ Cr), Q2 FY27 (Sep 2026): 2,317.38
Profit (₹ Cr)
- Profit (₹ Cr), Q2 FY26 (Sep 2025): 133.31
- Profit (₹ Cr), Q3 FY26 (Dec 2025): 117.05
- Profit (₹ Cr), Q4 FY26 (Mar 2026): 109.89
- Profit (₹ Cr), Q1 FY27 (Jun 2026): 228.41
- Profit (₹ Cr), Q2 FY27 (Sep 2026): 143.99
Net Profit Margin
- Net Profit Margin, Q2 FY26 (Sep 2025): 6.8%
- Net Profit Margin, Q3 FY26 (Dec 2025): 5.9%
- Net Profit Margin, Q4 FY26 (Mar 2026): 5.6%
- Net Profit Margin, Q1 FY27 (Jun 2026): 9.6%
- Net Profit Margin, Q2 FY27 (Sep 2026): 6.2%
| Metric | CurrentQ2 FY27 (Sep 2026) | PreviousQ1 FY27 (Jun 2026) |
|---|---|---|
| Revenue (₹ Cr) | 2,317.38 | 2,373.59 |
| Profit (₹ Cr) | 143.99 | 228.41 |
| Net Profit Margin | 6.2% | 9.6% |
Why margins fell off a cliff
The net profit margin fell 340 basis points from the previous quarter. According to reports from CNBC-TV18 and MarketsMojo, the core issue was a sharp rise in material costs. Raw material expenses consumed 70.1% of standalone revenue, up from 65% a year earlier.
This surge was driven by volatile prices for crude oil derivatives and titanium dioxide. Management told CNBC-TV18 it took calibrated price hikes, but intense competition limited its ability to fully pass on costs. The result was a severe squeeze on operating profit.
The growth that did arrive
Revenue growth was broad-based. Managing Director Pravin Chaudhari said both decorative and industrial businesses showed momentum, as reported by CNBC-TV18. The industrial segment, where Kansai holds leadership, saw strong demand across automotive and other key areas.
Live Chart
· KANSAINER
(BSE)
ISIN: INE531A01024
Yet, this growth came at a cost. The company's operating cash flow turned negative in the first half, a Multibagg.ai report noted, as rising receivables and inventories tied up capital. This reflects the working capital strain of pushing sales in a tough market.
How long will the squeeze last?
The outlook is clouded by the same pressures. Management expects supportive demand from the festive season and infrastructure activity. However, it continues to monitor raw material volatility and geopolitical uncertainty.
The company has a ₹601 crore capacity expansion plan funded internally, as per a Sahi.com report. This aims to boost industrial and resin capacity by FY29. For now, the path to its stated 13-14% EBITDA margin target for FY27 looks challenging with Q2 margins below 10%.
Key Points
- Kansai Nerolac's Q2 profit fell 37% sequentially despite 19% yearly revenue growth, highlighting severe margin pressure.
- The net profit margin contracted 340 basis points QoQ as material costs rose to 70.1% of revenue, outpacing the company's ability to raise prices.
- Both decorative and industrial segments contributed to top-line growth, but operating cash flow turned negative due to higher working capital.
- Management maintains its long-term margin guidance but faces near-term headwinds from volatile raw material costs and intense competition.
Hexa Perspective
The quarter underscores a structural challenge in paints: volume growth is achievable, but pricing power is elusive. Kansai Nerolac's net margin of 6.2% sits well below its trailing twelve-month average of 6.9% and its own mid-term ambitions.
With crude-linked input costs remaining elevated and new entrants keeping competition fierce, margin recovery is not imminent. The company's fortress balance sheet provides stability, but investors are weighing whether its industrial leadership can eventually translate into sustained profitability. The stock's 48% discount to the industry PE reflects this doubt.
Also read
Want this applied to your portfolio?
Talk to a HexaWealth advisor, or sync your mutual fund data for insights tailored to your holdings.