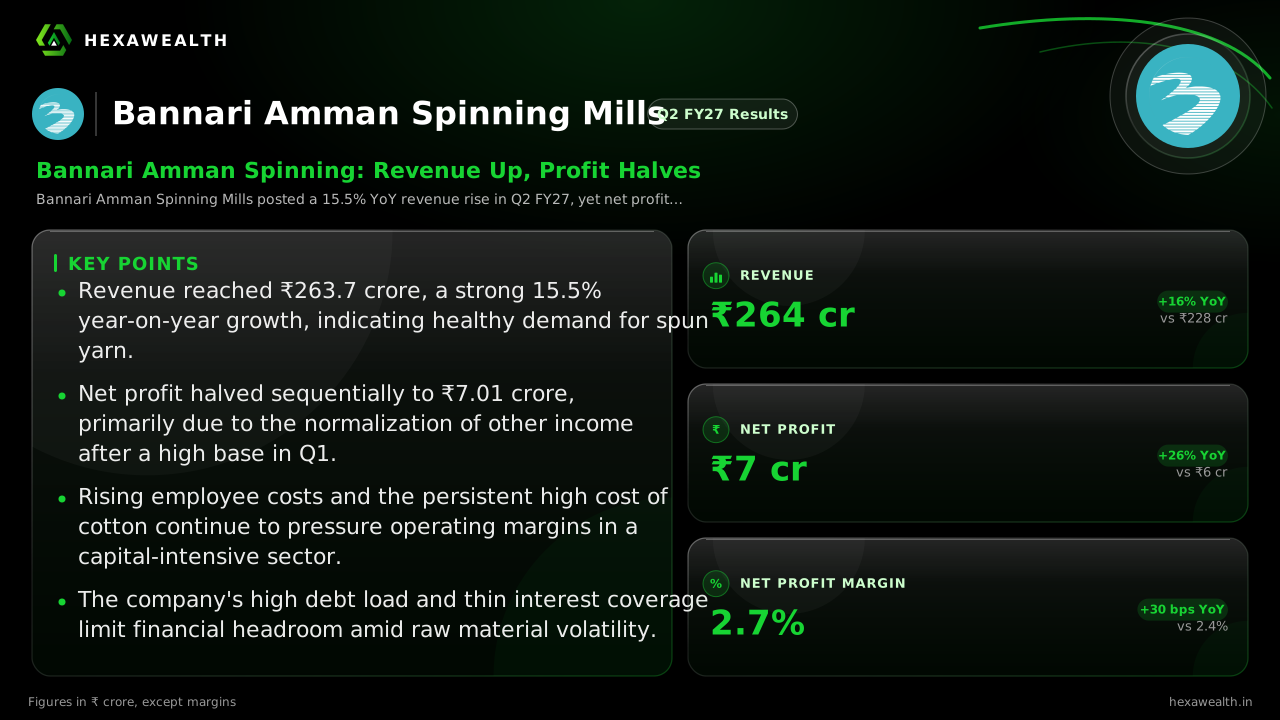
Bannari Amman Spinning Mills posted a 15.5% YoY revenue rise in Q2 FY27, yet net profit fell 48.8% from the previous quarter. The drop was driven by a steep decline in other income and rising employee costs, squeezing margins.
For a textile spinner like Bannari Amman, a quarter is defined by the gap between yarn prices and cotton costs. The September quarter saw sales volume push revenue to a multi-quarter high, but profitability slipped through that gap.
Revenue rose 15.5% year-on-year to ₹263.7 crore, the highest in at least five quarters. Sequentially, sales grew 21.8%. Yet, net profit fell 48.8% from the June quarter to ₹7.01 crore, though it remained 26.3% higher than a year ago. The net profit margin contracted sharply by 360 basis points to 2.7%.
Revenue & profit
Revenue (₹ Cr)
Profit (₹ Cr)
Revenue (₹ Cr), Q2 FY26 (Sep 2025): 228.32
Revenue (₹ Cr), Q3 FY26 (Dec 2025): 203.90
Revenue (₹ Cr), Q4 FY26 (Mar 2026): 220.71
Revenue (₹ Cr), Q1 FY27 (Jun 2026): 216.51
Revenue (₹ Cr), Q2 FY27 (Sep 2026): 263.69
Profit (₹ Cr), Q2 FY26 (Sep 2025): 5.55
Profit (₹ Cr), Q3 FY26 (Dec 2025): 2.26
Profit (₹ Cr), Q4 FY26 (Mar 2026): 1.38
Profit (₹ Cr), Q1 FY27 (Jun 2026): 13.69
Profit (₹ Cr), Q2 FY27 (Sep 2026): 7.01
Revenue (₹ Cr)
Revenue (₹ Cr), Q2 FY26 (Sep 2025): 228.32
Revenue (₹ Cr), Q3 FY26 (Dec 2025): 203.90
Revenue (₹ Cr), Q4 FY26 (Mar 2026): 220.71
Revenue (₹ Cr), Q1 FY27 (Jun 2026): 216.51
Revenue (₹ Cr), Q2 FY27 (Sep 2026): 263.69
Profit (₹ Cr)
Profit (₹ Cr), Q2 FY26 (Sep 2025): 5.55
Profit (₹ Cr), Q3 FY26 (Dec 2025): 2.26
Profit (₹ Cr), Q4 FY26 (Mar 2026): 1.38
Profit (₹ Cr), Q1 FY27 (Jun 2026): 13.69
Profit (₹ Cr), Q2 FY27 (Sep 2026): 7.01
Net Profit Margin (%)
Net Profit Margin (%), Q2 FY26 (Sep 2025): 2.4
Net Profit Margin (%), Q3 FY26 (Dec 2025): 1.1
Net Profit Margin (%), Q4 FY26 (Mar 2026): 0.6
Net Profit Margin (%), Q1 FY27 (Jun 2026): 6.3
Net Profit Margin (%), Q2 FY27 (Sep 2026): 2.7
Metric
CurrentQ2 FY27 (Sep 2026)
PreviousQ1 FY27 (Jun 2026)
Revenue (₹ Cr)
263.69
216.51
Profit (₹ Cr)
7.01
13.69
Net Profit Margin (%)
2.7
6.3
Why the profit fell as sales rose
The primary driver was a steep, 84.2% sequential drop in other income to just ₹0.23 crore. A Univest preview had noted that the bumper profit in the June quarter was likely flattered by one-off items. Its return to a more normal level this quarter explains much of the profit decline.
Simultaneously, operating costs rose. Employee costs surged 35.8% year-on-year and 12.2% sequentially. Total expenses grew 18% quarter-on-quarter, outpacing revenue growth and compressing margins.
The persistent sector squeeze
This cost pressure is sector-wide. Reports from Textile Insights and MSME Briefing in September noted that while cotton yarn demand has revived, pushing mill utilisation above 90%, a sharp rise in raw cotton prices is threatening margins. With mills holding lean inventories, any cotton price move quickly impacts costs.
Live Chart
· BASML
(BSE)
ISIN: INE186H01022
For Bannari Amman, this is compounded by a high interest burden, with interest coverage at 1.51x. Data from lax.sh shows borrowings around ₹396 crore, keeping financial flexibility tight.
A muted market reaction
The stock showed little immediate reaction, edging down 0.36% after the results, as per The Economic Times. The market appears to price in the volatility typical of this thin-margin business. No brokerage ratings or price target changes were reported by Barron's following the announcement.
Key Points
Revenue reached ₹263.7 crore, a strong 15.5% year-on-year growth, indicating healthy demand for spun yarn.
Net profit halved sequentially to ₹7.01 crore, primarily due to the normalization of other income after a high base in Q1.
Rising employee costs and the persistent high cost of cotton continue to pressure operating margins in a capital-intensive sector.
The company's high debt load and thin interest coverage limit financial headroom amid raw material volatility.
“
Hexa Perspective
The quarter underscores the fundamental challenge for spinners: revenue growth is fragile if it doesn't come with pricing power. The 360-basis-point margin contraction, even on higher sales, shows costs winning.
The outlook hinges on the cotton-yarn spread. With industry reports citing mills running at over 90% capacity, demand is not the issue. The question is whether rising cotton costs, a global factor, can be passed through. For Bannari Amman, with its leveraged balance sheet, the margin of error remains thin.
Talk to a HexaWealth advisor, or sync your mutual fund data for insights tailored to your holdings.
Frequently asked questions
What were Bannari Amman Spinning Mills' Q2 FY27 results?
For Q2 FY27 (September 2026 quarter), Bannari Amman Spinning Mills reported revenue of ₹263.69 crore and a net profit of ₹7.01 crore. Revenue grew 15.5% year-on-year, but profit fell 48.8% compared to the previous June 2026 quarter.
Why did Bannari Amman Spinning Mills' profit fall sharply in Q2 FY27 despite higher sales?
Profit fell 48.8% quarter-on-quarter mainly due to a steep 84.2% drop in other income, which had boosted the previous quarter's earnings. Rising employee costs, which grew 35.8% year-on-year, also pressured margins despite the revenue increase.
What was Bannari Amman Spinning Mills' net profit margin in Q2 FY27?
Bannari Amman Spinning Mills' net profit margin was 2.7% for the Q2 FY27 (September 2026) quarter. This represents a contraction of 360 basis points from the 6.3% margin recorded in the previous quarter.
What drove the 15.5% YoY revenue growth for Bannari Amman Spinning Mills in Q2 FY27?
The 15.5% year-on-year revenue growth to ₹263.69 crore was driven by stronger sales volumes, likely supported by a revival in cotton yarn demand. Industry reports from September 2026 noted mill capacity utilisation crossing 90%, indicating a healthier demand environment.
Why did employee costs surge 35.8% YoY for Bannari Amman Spinning Mills?
The company's employee benefit expenses rose 35.8% year-on-year to ₹26.02 crore in Q2 FY27. The specific reason for this sharp increase was not detailed in the available research, but it contributed significantly to the quarter's total expense growth of 14.4% year-on-year.
Why did other income drop so sharply for Bannari Amman Spinning Mills in Q2 FY27?
Other income fell 75.5% year-on-year and 84.2% quarter-on-quarter to ₹0.23 crore. This sharp decline suggests the previous quarter's profit of ₹13.69 crore was significantly aided by one-off, non-operating income, which normalized in the September quarter.
What is the status of Bannari Amman Spinning Mills' debt and interest coverage?
Bannari Amman Spinning Mills carries significant debt, with borrowings around ₹396 crore as of March 2026 according to lax.sh data. Its interest coverage ratio is thin at 1.51 times, indicating limited earnings cushion to cover its high interest expense of over ₹10 crore per quarter.
What guidance did Bannari Amman Spinning Mills management provide for FY27?
Available research from Univest and others indicates that management has not provided explicit forward guidance on revenue, margins, or capital expenditure following the Q2 FY27 results. The focus appears to be on operational continuity and compliance.
What is the current cotton price trend and its impact on spinning mills?
Reports from September 2026 highlight a sharp rise in cotton prices, threatening mill margins. While demand has revived, pushing capacity utilisation above 90%, the surge in raw material costs is squeezing profitability as mills struggle to fully pass on increases to buyers.
What is the capacity utilization at Bannari Amman Spinning Mills' spinning units?
The research does not specify the current quarter's utilisation rate for Bannari Amman's two units with 145,440 spindles. However, broader industry reports from September 2026 indicate spinning mill capacity utilisation across India had crossed 90%.
Did Bannari Amman Spinning Mills Q2 FY27 results beat or miss analyst estimates?
According to a Univest preview, no verified analyst consensus estimates were publicly available for Bannari Amman Spinning Mills' Q2 FY27 results. Therefore, the results cannot be classified as a beat or a miss against formal estimates.
How did Bannari Amman Spinning Mills stock react to the Q2 FY27 results?
The stock showed a muted reaction. Data from The Economic Times indicated Bannari Amman Spinning Mills' share price moved down by 0.36% following the Q2 FY27 results announcement, from a previous close of ₹22.66.
Bannari Amman Spinning Q2 FY27 Trends
The Q2 FY27 trend for Bannari Amman Spinning Mills was defined by strong revenue growth of 15.5% year-on-year to ₹263.69 crore, but a sharp sequential profit decline of 48.8% to ₹7.01 crore due to normalized other income and rising operating costs.
Bannari Amman Spinning Mills September quarter profit
Bannari Amman Spinning Mills reported a net profit of ₹7.01 crore for the September 2026 quarter (Q2 FY27). This was 26.3% higher than the ₹5.55 crore profit in the same quarter last year, but nearly half the ₹13.69 crore profit from the preceding June 2026 quarter.