Bal Pharma (BALPHARMA) Q2 FY27 Profit Nearly Doubles as Revenue Growth Outpaces Rising Costs
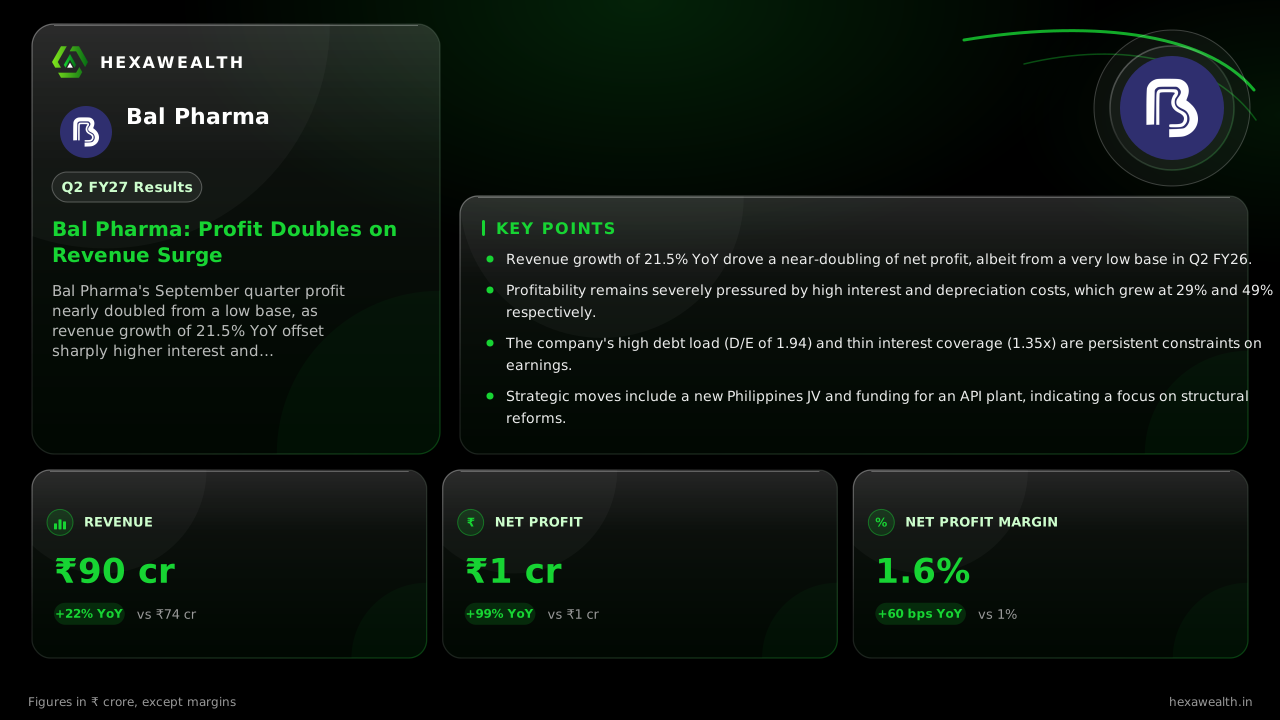
Bal Pharma's Q2 FY27 net profit jumped 98.6% year-on-year to ₹1.43 crore, driven by a 21.5% revenue surge, though rising interest and depreciation costs kept margins thin.
Bal Pharma's September quarter profit nearly doubled from a low base, as revenue growth of 21.5% YoY offset sharply higher interest and depreciation expenses. The company's net profit margin remains under pressure at 1.6%.
For Bal Pharma, the September quarter was a story of growth finally reaching the bottom line, but only after a fierce contest with its own rising costs. Revenue climbed 21.5% year-on-year to ₹89.95 crore, lifting net profit 98.6% to ₹1.43 crore from a low base of ₹0.72 crore a year ago.
The numbers show a company in motion, with revenue hitting a five-quarter high. Profit also grew 25.4% sequentially from the June quarter. Yet the net profit margin, while improved, remains wafer-thin at 1.6%.
Revenue & profit
Revenue (₹ Cr)
Profit (₹ Cr)
- Revenue (₹ Cr), Q2 FY26 (Sep 2025): 74.03
- Revenue (₹ Cr), Q3 FY26 (Dec 2025): 87.69
- Revenue (₹ Cr), Q4 FY26 (Mar 2026): 84.08
- Revenue (₹ Cr), Q1 FY27 (Jun 2026): 88.62
- Revenue (₹ Cr), Q2 FY27 (Sep 2026): 89.95
- Profit (₹ Cr), Q2 FY26 (Sep 2025): 0.72
- Profit (₹ Cr), Q3 FY26 (Dec 2025): 1.79
- Profit (₹ Cr), Q4 FY26 (Mar 2026): 3.60
- Profit (₹ Cr), Q1 FY27 (Jun 2026): 1.14
- Profit (₹ Cr), Q2 FY27 (Sep 2026): 1.43
Revenue (₹ Cr)
- Revenue (₹ Cr), Q2 FY26 (Sep 2025): 74.03
- Revenue (₹ Cr), Q3 FY26 (Dec 2025): 87.69
- Revenue (₹ Cr), Q4 FY26 (Mar 2026): 84.08
- Revenue (₹ Cr), Q1 FY27 (Jun 2026): 88.62
- Revenue (₹ Cr), Q2 FY27 (Sep 2026): 89.95
Profit (₹ Cr)
- Profit (₹ Cr), Q2 FY26 (Sep 2025): 0.72
- Profit (₹ Cr), Q3 FY26 (Dec 2025): 1.79
- Profit (₹ Cr), Q4 FY26 (Mar 2026): 3.60
- Profit (₹ Cr), Q1 FY27 (Jun 2026): 1.14
- Profit (₹ Cr), Q2 FY27 (Sep 2026): 1.43
Net Profit Margin (%)
- Net Profit Margin (%), Q2 FY26 (Sep 2025): 1.0
- Net Profit Margin (%), Q3 FY26 (Dec 2025): 2.0
- Net Profit Margin (%), Q4 FY26 (Mar 2026): 4.3
- Net Profit Margin (%), Q1 FY27 (Jun 2026): 1.3
- Net Profit Margin (%), Q2 FY27 (Sep 2026): 1.6
| Metric | CurrentQ2 FY27 (Sep 2026) | PreviousQ1 FY27 (Jun 2026) |
|---|---|---|
| Revenue (₹ Cr) | 89.95 | 88.62 |
| Profit (₹ Cr) | 1.43 | 1.14 |
| Net Profit Margin (%) | 1.6 | 1.3 |
The Cost That Ate the Growth
A surge in other income, which jumped 272% quarter-on-quarter to ₹1.63 crore, provided critical support to the bottom line. Without it, the profit growth story would have been far less compelling. The company's core profitability was squeezed by two major cost lines rising faster than sales.
Interest expense soared 29.1% year-on-year to ₹4.98 crore. Depreciation rose even more sharply, up 48.8% to ₹3.38 crore. These increases reflect the company's elevated debt load and ongoing capital expenditure, which a report from Stockfin.ai notes is funding a strategic shift rather than aggressive growth.
A Heavy Financial Structure
The burden of these costs is structural. Bal Pharma carries a debt-to-equity ratio of 1.94, according to the Bull Run analysis platform. Its interest coverage ratio is a tight 1.35x, meaning operating earnings barely cover its interest obligations.
Live Chart
· BALPHARMA
(BSE)
ISIN: INE083D01012
This high leverage is the primary reason so little operating profit reaches shareholders. It also means that for profit growth to be sustainable, revenue must continue to outpace these fixed financial costs by a significant margin.
The Path Ahead
Management is not standing still. In August, the board approved a ₹9 crore investment in a joint venture in the Philippines, as reported by Investor Feed. It also approved a preferential warrant issue to a promoter to raise ₹8.4 crore, earmarked for an API manufacturing facility.
These moves point to a focus on governance and capital efficiency over rapid expansion. The market appears to be weighing this cautious approach against the company's financial constraints, with the stock trading at a significant discount to the industry average.
Key Points
- Revenue growth of 21.5% YoY drove a near-doubling of net profit, albeit from a very low base in Q2 FY26.
- Profitability remains severely pressured by high interest and depreciation costs, which grew at 29% and 49% respectively.
- The company's high debt load (D/E of 1.94) and thin interest coverage (1.35x) are persistent constraints on earnings.
- Strategic moves include a new Philippines JV and funding for an API plant, indicating a focus on structural reforms.
Hexa Perspective
The quarter confirms Bal Pharma's ability to grow its top line in a competitive market. The real tension, however, is between that growth and a capital structure that consumes a large portion of it.
With interest and depreciation charges rising steeply, the company needs sustained, high-quality revenue growth just to maintain current profit levels. The strategic investments in new ventures and capacity are necessary, but they add to the depreciation burden in the near term.
The investment case hinges on whether management's focus on governance and capital efficiency can gradually improve the return profile. Until the debt burden lightens, earnings will remain vulnerable to any slowdown in sales momentum.
Also read
Want this applied to your portfolio?
Talk to a HexaWealth advisor, or sync your mutual fund data for insights tailored to your holdings.